29
/de/
de
AIzaSyAYiBZKx7MnpbEhh9jyipgxe19OcubqV5w
April 1, 2024
243414
Solomon Islands
SLB
true
2
1
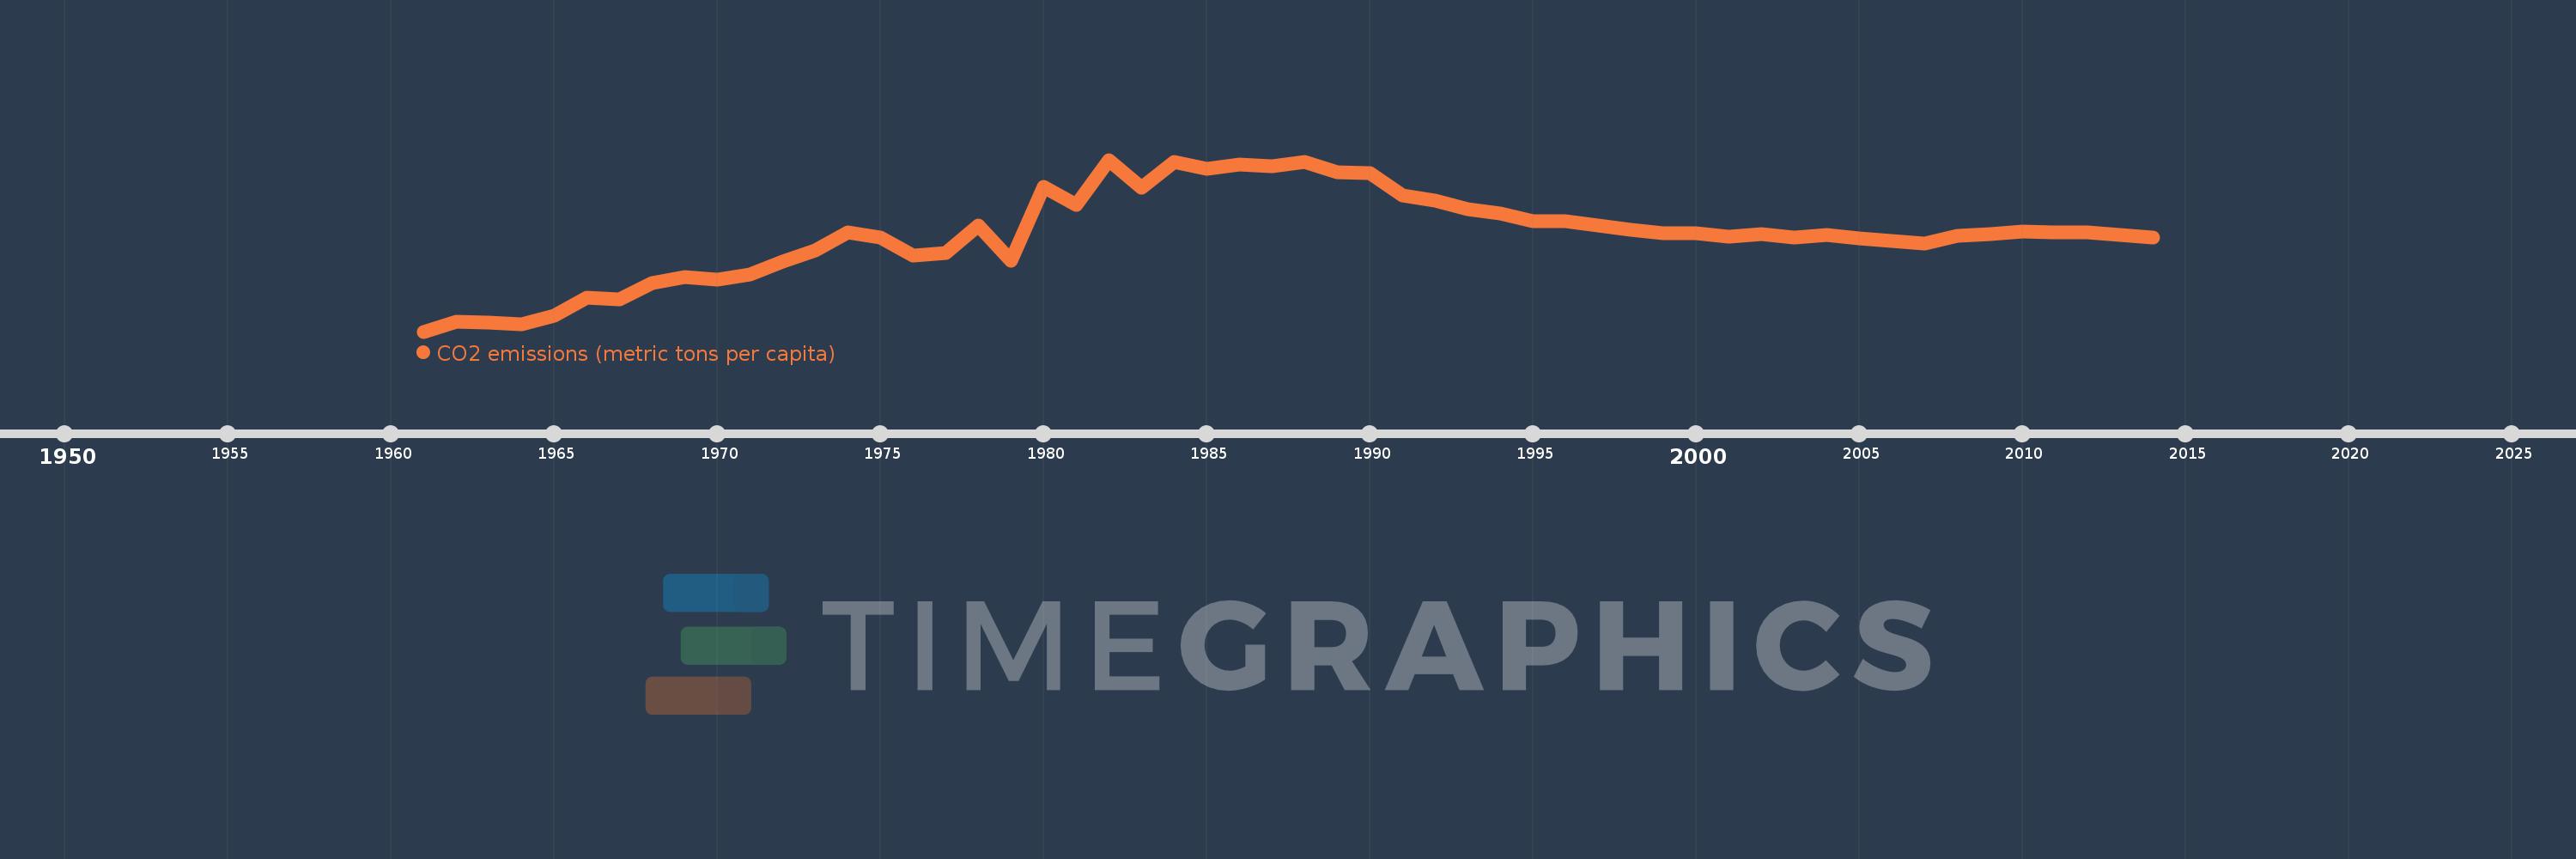
CO2 emissions (metric tons per capita)
2014,2013,2012,2011,2010,2009,2008,2007,2006,2005,2004,2003,2002,2001,2000,1999,1998,1997,1996,1995,1994,1993,1992,1991,1990,1989,1988,1987,1986,1985,1984,1983,1982,1981,1980,1979,1978,1977,1976,1975,1974,1973,1972,1971,1970,1969,1968,1967,1966,1965,1964,1963,1962,1961
Diese Statistik in anderen Ländern:
AfghanistanAlbaniaAlgeriaAndorraAngolaAntigua and BarbudaArab WorldArgentinaArmeniaArubaAustraliaAustriaAzerbaijanBahamas, TheBahrainBangladeshBarbadosBelarusBelgiumBelizeBeninBermudaBhutanBoliviaBosnia and HerzegovinaBotswanaBrazilBritish Virgin IslandsBrunei DarussalamBulgariaBurkina FasoBurundiCabo VerdeCambodiaCameroonCanadaCaribbean small statesCayman IslandsCentral African RepublicCentral Europe and the BalticsChadChileChinaColombiaComorosCongo, Dem. Rep.Congo, Rep.Costa RicaCote d'IvoireCroatiaCubaCuracaoCyprusCzech RepublicDenmarkDjiboutiDominicaDominican RepublicEarly-demographic dividendEast Asia & PacificEast Asia & Pacific (excluding high income)East Asia & Pacific (IDA & IBRD countries)EcuadorEgypt, Arab Rep.El SalvadorEquatorial GuineaEritreaEstoniaEthiopiaEuro areaEurope & Central AsiaEurope & Central Asia (excluding high income)Europe & Central Asia (IDA & IBRD countries)European UnionFaroe IslandsFijiFinlandFragile and conflict affected situationsFranceFrench PolynesiaGabonGambia, TheGeorgiaGermanyGhanaGibraltarGreeceGreenlandGrenadaGuatemalaGuineaGuinea-BissauGuyanaHaitiHeavily indebted poor countries (HIPC)High incomeHondurasHong Kong SAR, ChinaHungaryIBRD onlyIcelandIDA & IBRD totalIDA blendIDA onlyIDA totalIndiaIndonesiaIran, Islamic Rep.IraqIrelandIsraelItalyJamaicaJapanJordanKazakhstanKenyaKiribatiKorea, Dem. People’s Rep.Korea, Rep.KuwaitKyrgyz RepublicLao PDRLate-demographic dividendLatin America & Caribbean Latin America & Caribbean (excluding high income)Latin America & the Caribbean (IDA & IBRD countries)LatviaLeast developed countries: UN classificationLebanonLesothoLiberiaLibyaLiechtensteinLithuaniaLow & middle incomeLow incomeLower middle incomeLuxembourgMacao SAR, ChinaMacedonia, FYRMadagascarMalawiMalaysiaMaldivesMaliMaltaMarshall IslandsMauritaniaMauritiusMexicoMicronesia, Fed. Sts.Middle East & North AfricaMiddle East & North Africa (excluding high income)Middle East & North Africa (IDA & IBRD countries)Middle incomeMoldovaMongoliaMontenegroMoroccoMozambiqueMyanmarNamibiaNauruNepalNetherlandsNew CaledoniaNew ZealandNicaraguaNigerNigeriaNorth AmericaNorwayOECD membersOmanOther small statesPacific island small statesPakistanPalauPanamaPapua New GuineaParaguayPeruPhilippinesPolandPortugalPost-demographic dividendPre-demographic dividendQatarRomaniaRussian FederationRwandaSamoaSao Tome and PrincipeSaudi ArabiaSenegalSerbiaSeychellesSierra LeoneSingaporeSint Maarten (Dutch part)Slovak RepublicSloveniaSmall statesSolomon IslandsSomaliaSouth AfricaSouth AsiaSouth Asia (IDA & IBRD)South SudanSpainSri LankaSt. Kitts and NevisSt. LuciaSt. Vincent and the GrenadinesSub-Saharan Africa Sub-Saharan Africa (excluding high income)Sub-Saharan Africa (IDA & IBRD countries)SudanSurinameSwazilandSwedenSwitzerlandSyrian Arab RepublicTajikistanTanzaniaThailandTimor-LesteTogoTongaTrinidad and TobagoTunisiaTurkeyTurkmenistanTurks and Caicos IslandsUgandaUkraineUnited Arab EmiratesUnited KingdomUnited StatesUpper middle incomeUruguayUzbekistanVanuatuVenezuela, RBVietnamWest Bank and GazaWorldYemen, Rep.ZambiaZimbabwe Zeitlinie:
Diese Zeitleiste vorliegt die Graphik ab 1961 J. bis 2014 J. Solomon Islands. Die Angaben bis 1960 J. sind nicht vorhanden. Die Zahl aktueller Beobachtungen nach Daten: 54.
Die Quelle (Bezeichnung):
Kennzahlen der Weltentwicklung
Die Quelle (Einrichtung):
Carbon Dioxide Information Analysis Center, Environmental Sciences Division, Oak Ridge National Laboratory, Tennessee, United States.
Kategorien:
Climate Change, Environment
Es wurde aktualisiert:
23 Apr 2017 Jahr
Kennzahlen der Wertänderungen vom Jahr zum Jahr
Minimum:
0.093
1 Jan 1961 Jahr
Maximum:
0.569
1 Jan 1982 Jahr
Zum Datum der Beobachtung
Wert
Absolute Veränderung
Die Veränderung bezüglich dem vorherigen Wert
1 Jan 1961 Jahr
0.093
+0.093
0.0%
1 Jan 1962 Jahr
0.121
+0.027
29.45%
1 Jan 1963 Jahr
0.117
-0.004
-2.93%
1 Jan 1964 Jahr
0.114
-0.003
-2.94%
1 Jan 1965 Jahr
0.138
+0.024
21.31%
1 Jan 1966 Jahr
0.188
+0.049
35.85%
1 Jan 1967 Jahr
0.182
-0.006
-2.96%
1 Jan 1968 Jahr
0.227
+0.045
24.74%
1 Jan 1969 Jahr
0.245
+0.018
7.72%
1 Jan 1970 Jahr
0.237
-0.008
-3.2%
1 Jan 1971 Jahr
0.252
+0.015
6.28%
1 Jan 1972 Jahr
0.287
+0.035
13.97%
1 Jan 1973 Jahr
0.319
+0.032
11.12%
1 Jan 1974 Jahr
0.368
+0.049
15.48%
1 Jan 1975 Jahr
0.354
-0.014
-3.75%
1 Jan 1976 Jahr
0.303
-0.051
-14.38%
1 Jan 1977 Jahr
0.311
+0.007
2.44%
1 Jan 1978 Jahr
0.388
+0.077
24.87%
1 Jan 1979 Jahr
0.289
-0.098
-25.39%
1 Jan 1980 Jahr
0.494
+0.204
70.49%
1 Jan 1981 Jahr
0.445
-0.048
-9.79%
1 Jan 1982 Jahr
0.569
+0.124
27.78%
1 Jan 1983 Jahr
0.491
-0.078
-13.71%
1 Jan 1984 Jahr
0.562
+0.071
14.42%
1 Jan 1985 Jahr
0.544
-0.017
-3.09%
1 Jan 1986 Jahr
0.555
+0.011
1.99%
1 Jan 1987 Jahr
0.552
-0.003
-0.51%
1 Jan 1988 Jahr
0.562
+0.01
1.83%
1 Jan 1989 Jahr
0.535
-0.028
-4.95%
1 Jan 1990 Jahr
0.532
-0.003
-0.47%
1 Jan 1991 Jahr
0.47
-0.062
-11.6%
1 Jan 1992 Jahr
0.457
-0.013
-2.78%
1 Jan 1993 Jahr
0.433
-0.024
-5.22%
1 Jan 1994 Jahr
0.421
-0.012
-2.8%
1 Jan 1995 Jahr
0.399
-0.022
-5.29%
1 Jan 1996 Jahr
0.398
-0.001
-0.22%
1 Jan 1997 Jahr
0.387
-0.011
-2.76%
1 Jan 1998 Jahr
0.376
-0.011
-2.74%
1 Jan 1999 Jahr
0.366
-0.01
-2.72%
1 Jan 2000 Jahr
0.365
-0.001
-0.2%
1 Jan 2001 Jahr
0.356
-0.01
-2.67%
1 Jan 2002 Jahr
0.364
+0.008
2.22%
1 Jan 2003 Jahr
0.354
-0.009
-2.61%
1 Jan 2004 Jahr
0.361
+0.007
2.07%
1 Jan 2005 Jahr
0.352
-0.009
-2.51%
1 Jan 2006 Jahr
0.344
-0.009
-2.44%
1 Jan 2007 Jahr
0.336
-0.008
-2.37%
1 Jan 2008 Jahr
0.358
+0.022
6.57%
1 Jan 2009 Jahr
0.364
+0.007
1.82%
1 Jan 2010 Jahr
0.37
+0.006
1.71%
1 Jan 2011 Jahr
0.369
-0.001
-0.29%
1 Jan 2012 Jahr
0.368
-0.001
-0.29%
1 Jan 2013 Jahr
0.361
-0.008
-2.1%
1 Jan 2014 Jahr
0.353
-0.007
-2.06%
Bewertung der Länder gemäß mit laufender Statistik nach Jahren


Kommentare: