29
/de/
de
AIzaSyAYiBZKx7MnpbEhh9jyipgxe19OcubqV5w
April 1, 2024
101753
Cayman Islands
CYM
true
2
1
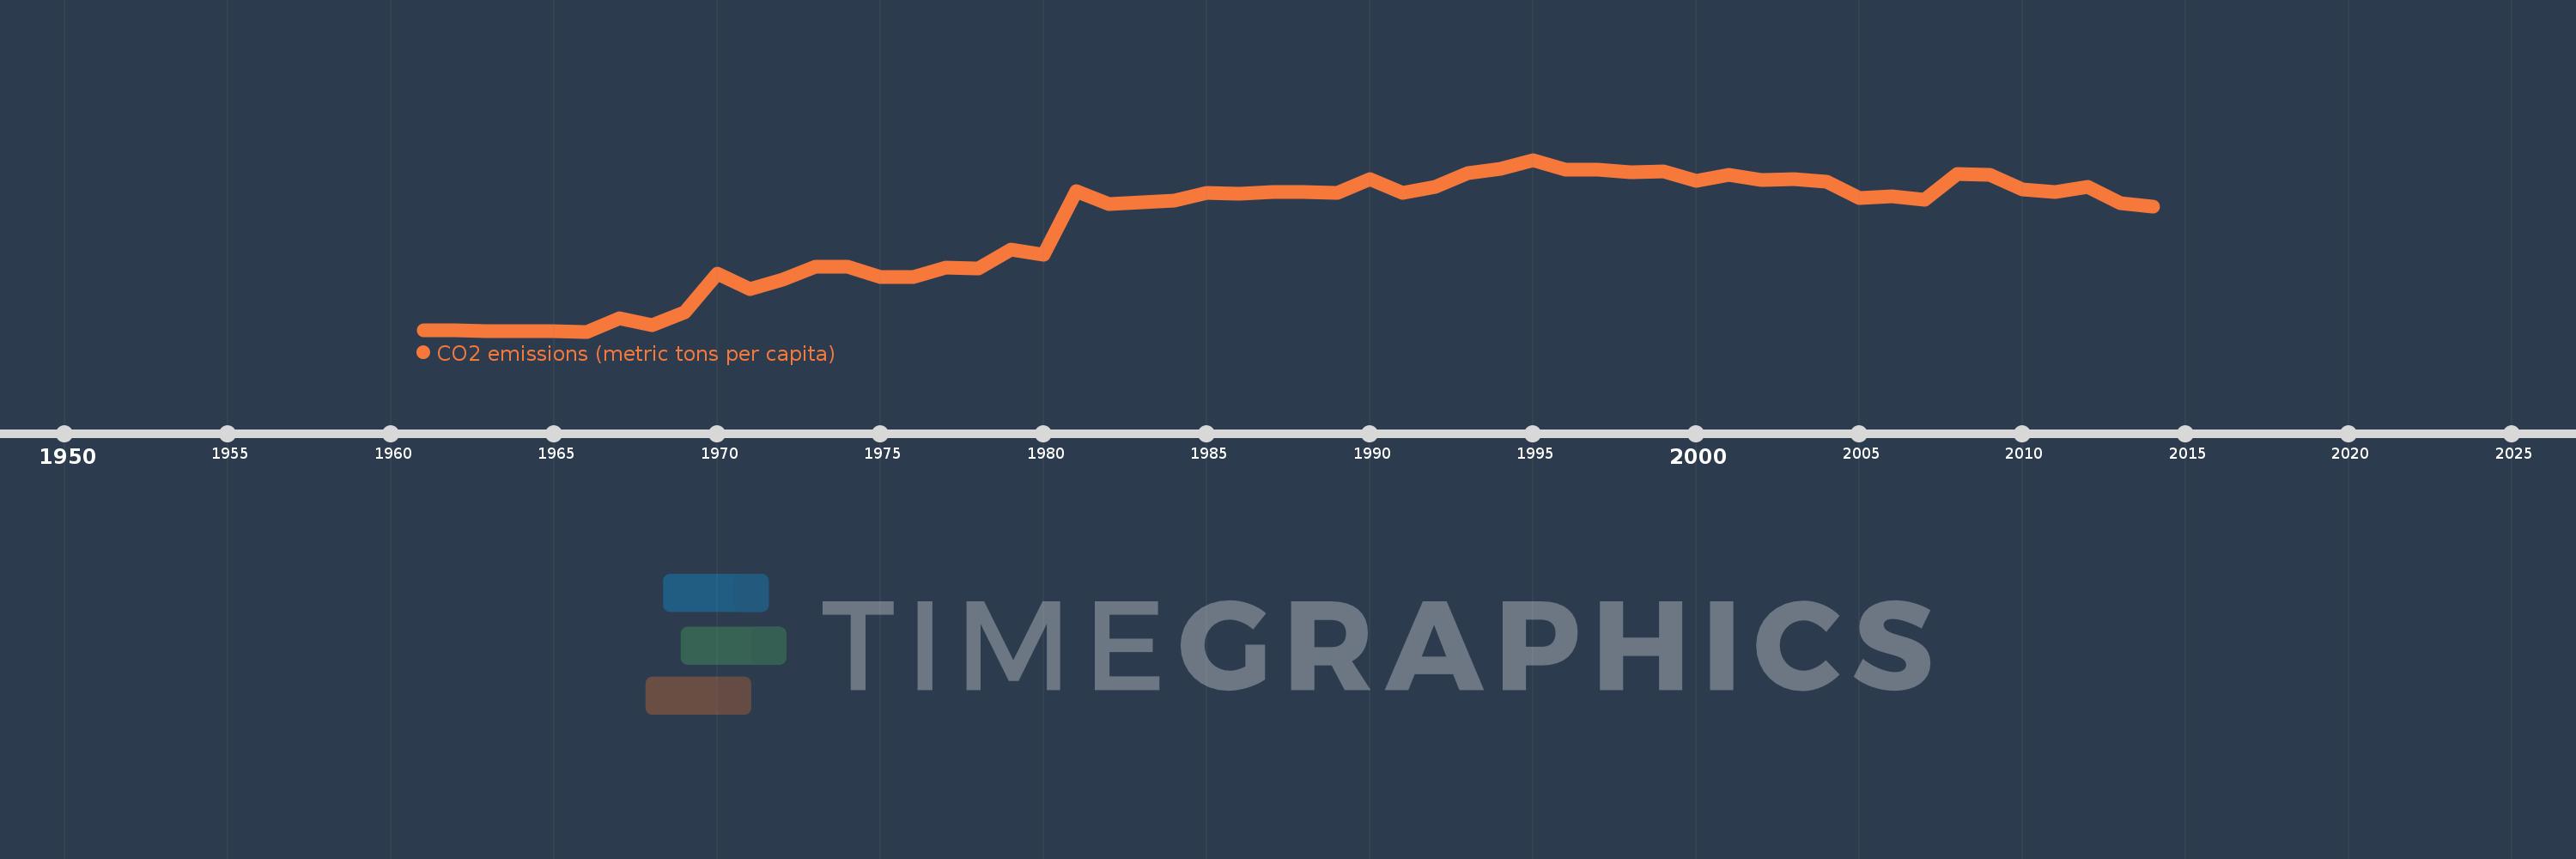
CO2 emissions (metric tons per capita)
2014,2013,2012,2011,2010,2009,2008,2007,2006,2005,2004,2003,2002,2001,2000,1999,1998,1997,1996,1995,1994,1993,1992,1991,1990,1989,1988,1987,1986,1985,1984,1983,1982,1981,1980,1979,1978,1977,1976,1975,1974,1973,1972,1971,1970,1969,1968,1967,1966,1965,1964,1963,1962,1961
Diese Statistik in anderen Ländern:
AfghanistanAlbaniaAlgeriaAndorraAngolaAntigua and BarbudaArab WorldArgentinaArmeniaArubaAustraliaAustriaAzerbaijanBahamas, TheBahrainBangladeshBarbadosBelarusBelgiumBelizeBeninBermudaBhutanBoliviaBosnia and HerzegovinaBotswanaBrazilBritish Virgin IslandsBrunei DarussalamBulgariaBurkina FasoBurundiCabo VerdeCambodiaCameroonCanadaCaribbean small statesCayman IslandsCentral African RepublicCentral Europe and the BalticsChadChileChinaColombiaComorosCongo, Dem. Rep.Congo, Rep.Costa RicaCote d'IvoireCroatiaCubaCuracaoCyprusCzech RepublicDenmarkDjiboutiDominicaDominican RepublicEarly-demographic dividendEast Asia & PacificEast Asia & Pacific (excluding high income)East Asia & Pacific (IDA & IBRD countries)EcuadorEgypt, Arab Rep.El SalvadorEquatorial GuineaEritreaEstoniaEthiopiaEuro areaEurope & Central AsiaEurope & Central Asia (excluding high income)Europe & Central Asia (IDA & IBRD countries)European UnionFaroe IslandsFijiFinlandFragile and conflict affected situationsFranceFrench PolynesiaGabonGambia, TheGeorgiaGermanyGhanaGibraltarGreeceGreenlandGrenadaGuatemalaGuineaGuinea-BissauGuyanaHaitiHeavily indebted poor countries (HIPC)High incomeHondurasHong Kong SAR, ChinaHungaryIBRD onlyIcelandIDA & IBRD totalIDA blendIDA onlyIDA totalIndiaIndonesiaIran, Islamic Rep.IraqIrelandIsraelItalyJamaicaJapanJordanKazakhstanKenyaKiribatiKorea, Dem. People’s Rep.Korea, Rep.KuwaitKyrgyz RepublicLao PDRLate-demographic dividendLatin America & Caribbean Latin America & Caribbean (excluding high income)Latin America & the Caribbean (IDA & IBRD countries)LatviaLeast developed countries: UN classificationLebanonLesothoLiberiaLibyaLiechtensteinLithuaniaLow & middle incomeLow incomeLower middle incomeLuxembourgMacao SAR, ChinaMacedonia, FYRMadagascarMalawiMalaysiaMaldivesMaliMaltaMarshall IslandsMauritaniaMauritiusMexicoMicronesia, Fed. Sts.Middle East & North AfricaMiddle East & North Africa (excluding high income)Middle East & North Africa (IDA & IBRD countries)Middle incomeMoldovaMongoliaMontenegroMoroccoMozambiqueMyanmarNamibiaNauruNepalNetherlandsNew CaledoniaNew ZealandNicaraguaNigerNigeriaNorth AmericaNorwayOECD membersOmanOther small statesPacific island small statesPakistanPalauPanamaPapua New GuineaParaguayPeruPhilippinesPolandPortugalPost-demographic dividendPre-demographic dividendQatarRomaniaRussian FederationRwandaSamoaSao Tome and PrincipeSaudi ArabiaSenegalSerbiaSeychellesSierra LeoneSingaporeSint Maarten (Dutch part)Slovak RepublicSloveniaSmall statesSolomon IslandsSomaliaSouth AfricaSouth AsiaSouth Asia (IDA & IBRD)South SudanSpainSri LankaSt. Kitts and NevisSt. LuciaSt. Vincent and the GrenadinesSub-Saharan Africa Sub-Saharan Africa (excluding high income)Sub-Saharan Africa (IDA & IBRD countries)SudanSurinameSwazilandSwedenSwitzerlandSyrian Arab RepublicTajikistanTanzaniaThailandTimor-LesteTogoTongaTrinidad and TobagoTunisiaTurkeyTurkmenistanTurks and Caicos IslandsUgandaUkraineUnited Arab EmiratesUnited KingdomUnited StatesUpper middle incomeUruguayUzbekistanVanuatuVenezuela, RBVietnamWest Bank and GazaWorldYemen, Rep.ZambiaZimbabwe Zeitlinie:
Diese Zeitleiste vorliegt die Graphik ab 1961 J. bis 2014 J. Cayman Islands. Die Angaben bis 1960 J. sind nicht vorhanden. Die Zahl aktueller Beobachtungen nach Daten: 54.
Die Quelle (Bezeichnung):
Kennzahlen der Weltentwicklung
Die Quelle (Einrichtung):
Carbon Dioxide Information Analysis Center, Environmental Sciences Division, Oak Ridge National Laboratory, Tennessee, United States.
Kategorien:
Climate Change, Environment
Es wurde aktualisiert:
23 Apr 2017 Jahr
Kennzahlen der Wertänderungen vom Jahr zum Jahr
Minimum:
1.314
1 Jan 1966 Jahr
Maximum:
12.201
1 Jan 1995 Jahr
Zum Datum der Beobachtung
Wert
Absolute Veränderung
Die Veränderung bezüglich dem vorherigen Wert
1 Jan 1961 Jahr
1.398
+1.398
0.0%
1 Jan 1962 Jahr
1.371
-0.028
-1.98%
1 Jan 1963 Jahr
1.351
-0.02
-1.42%
1 Jan 1964 Jahr
1.337
-0.014
-1.05%
1 Jan 1965 Jahr
1.326
-0.011
-0.86%
1 Jan 1966 Jahr
1.314
-0.011
-0.86%
1 Jan 1967 Jahr
2.172
+0.858
65.26%
1 Jan 1968 Jahr
1.722
-0.45
-20.71%
1 Jan 1969 Jahr
2.549
+0.827
48.02%
1 Jan 1970 Jahr
4.983
+2.434
95.49%
1 Jan 1971 Jahr
4.01
-0.973
-19.52%
1 Jan 1972 Jahr
4.592
+0.582
14.5%
1 Jan 1973 Jahr
5.426
+0.834
18.17%
1 Jan 1974 Jahr
5.44
+0.014
0.26%
1 Jan 1975 Jahr
4.786
-0.655
-12.03%
1 Jan 1976 Jahr
4.794
+0.009
0.18%
1 Jan 1977 Jahr
5.351
+0.557
11.62%
1 Jan 1978 Jahr
5.299
-0.052
-0.97%
1 Jan 1979 Jahr
6.502
+1.203
22.7%
1 Jan 1980 Jahr
6.172
-0.33
-5.08%
1 Jan 1981 Jahr
10.209
+4.037
65.4%
1 Jan 1982 Jahr
9.389
-0.82
-8.03%
1 Jan 1983 Jahr
9.507
+0.119
1.26%
1 Jan 1984 Jahr
9.623
+0.115
1.21%
1 Jan 1985 Jahr
10.086
+0.463
4.81%
1 Jan 1986 Jahr
10.062
-0.023
-0.23%
1 Jan 1987 Jahr
10.139
+0.077
0.76%
1 Jan 1988 Jahr
10.137
-0.002
-0.02%
1 Jan 1989 Jahr
10.087
-0.05
-0.49%
1 Jan 1990 Jahr
10.95
+0.863
8.56%
1 Jan 1991 Jahr
10.117
-0.833
-7.61%
1 Jan 1992 Jahr
10.493
+0.375
3.71%
1 Jan 1993 Jahr
11.375
+0.882
8.41%
1 Jan 1994 Jahr
11.647
+0.272
2.39%
1 Jan 1995 Jahr
12.201
+0.554
4.76%
1 Jan 1996 Jahr
11.578
-0.623
-5.11%
1 Jan 1997 Jahr
11.591
+0.013
0.11%
1 Jan 1998 Jahr
11.435
-0.156
-1.35%
1 Jan 1999 Jahr
11.465
+0.03
0.26%
1 Jan 2000 Jahr
10.869
-0.596
-5.19%
1 Jan 2001 Jahr
11.26
+0.391
3.6%
1 Jan 2002 Jahr
10.92
-0.34
-3.02%
1 Jan 2003 Jahr
10.982
+0.062
0.57%
1 Jan 2004 Jahr
10.834
-0.148
-1.35%
1 Jan 2005 Jahr
9.769
-1.065
-9.83%
1 Jan 2006 Jahr
9.88
+0.111
1.14%
1 Jan 2007 Jahr
9.675
-0.204
-2.07%
1 Jan 2008 Jahr
11.326
+1.65
17.06%
1 Jan 2009 Jahr
11.224
-0.101
-0.9%
1 Jan 2010 Jahr
10.335
-0.889
-7.92%
1 Jan 2011 Jahr
10.173
-0.162
-1.57%
1 Jan 2012 Jahr
10.499
+0.326
3.2%
1 Jan 2013 Jahr
9.435
-1.064
-10.14%
1 Jan 2014 Jahr
9.235
-0.2
-2.12%
Bewertung der Länder gemäß mit laufender Statistik nach Jahren


Kommentare: