29
/de/
de
AIzaSyAYiBZKx7MnpbEhh9jyipgxe19OcubqV5w
April 1, 2024
209943
Nicaragua
NIC
true
2
1
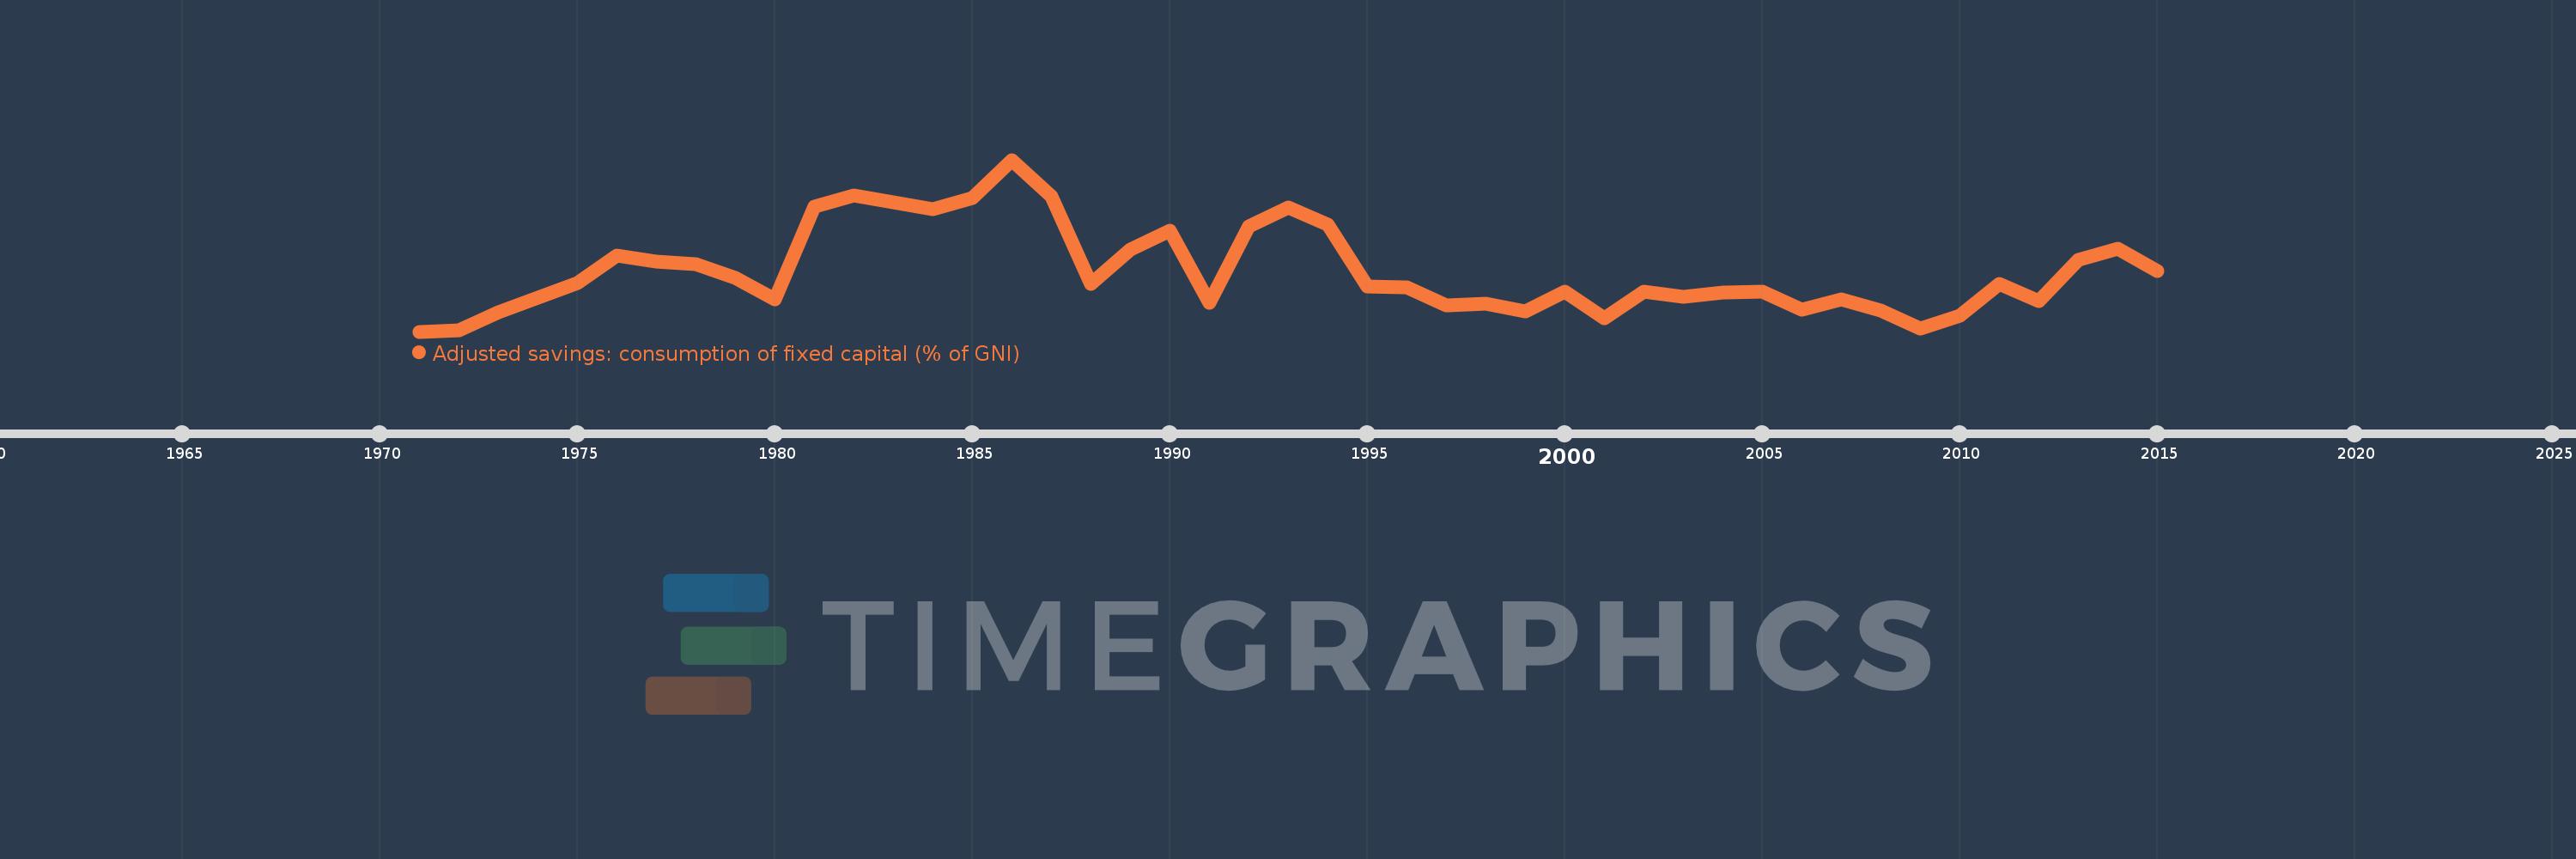
Adjusted savings: consumption of fixed capital (% of GNI)
2015,2014,2013,2012,2011,2010,2009,2008,2007,2006,2005,2004,2003,2002,2001,2000,1999,1998,1997,1996,1995,1994,1993,1992,1991,1990,1989,1988,1987,1986,1985,1984,1983,1982,1981,1980,1979,1978,1977,1976,1975,1974,1973,1972,1971
Diese Statistik in anderen Ländern:
AfghanistanAlbaniaAlgeriaAndorraAngolaAntigua and BarbudaArab WorldArgentinaArmeniaAustraliaAustriaAzerbaijanBahamas, TheBahrainBangladeshBarbadosBelarusBelgiumBelizeBeninBermudaBhutanBoliviaBosnia and HerzegovinaBotswanaBrazilBrunei DarussalamBulgariaBurkina FasoBurundiCabo VerdeCambodiaCameroonCanadaCaribbean small statesCentral African RepublicCentral Europe and the BalticsChadChileChinaColombiaComorosCongo, Dem. Rep.Congo, Rep.Costa RicaCote d'IvoireCroatiaCubaCyprusCzech RepublicDenmarkDjiboutiDominicaDominican RepublicEarly-demographic dividendEast Asia & PacificEast Asia & Pacific (excluding high income)East Asia & Pacific (IDA & IBRD countries)EcuadorEgypt, Arab Rep.El SalvadorEquatorial GuineaEritreaEstoniaEthiopiaEuro areaEurope & Central AsiaEurope & Central Asia (excluding high income)Europe & Central Asia (IDA & IBRD countries)European UnionFijiFinlandFragile and conflict affected situationsFranceGabonGambia, TheGeorgiaGermanyGhanaGreeceGreenlandGrenadaGuatemalaGuineaGuinea-BissauGuyanaHaitiHeavily indebted poor countries (HIPC)High incomeHondurasHong Kong SAR, ChinaHungaryIBRD onlyIcelandIDA & IBRD totalIDA blendIDA onlyIDA totalIndiaIndonesiaIran, Islamic Rep.IraqIrelandIsraelItalyJamaicaJapanJordanKazakhstanKenyaKiribatiKorea, Rep.KosovoKuwaitKyrgyz RepublicLao PDRLate-demographic dividendLatin America & Caribbean Latin America & Caribbean (excluding high income)Latin America & the Caribbean (IDA & IBRD countries)LatviaLeast developed countries: UN classificationLebanonLesothoLiberiaLibyaLiechtensteinLithuaniaLow & middle incomeLow incomeLower middle incomeLuxembourgMacao SAR, ChinaMacedonia, FYRMadagascarMalawiMalaysiaMaldivesMaliMaltaMarshall IslandsMauritaniaMauritiusMexicoMicronesia, Fed. Sts.Middle East & North AfricaMiddle East & North Africa (excluding high income)Middle East & North Africa (IDA & IBRD countries)Middle incomeMoldovaMonacoMongoliaMontenegroMoroccoMozambiqueMyanmarNamibiaNepalNetherlandsNew ZealandNicaraguaNigerNigeriaNorth AmericaNorwayOECD membersOmanOther small statesPacific island small statesPakistanPalauPanamaPapua New GuineaParaguayPeruPhilippinesPolandPortugalPost-demographic dividendPre-demographic dividendPuerto RicoQatarRomaniaRussian FederationRwandaSamoaSan MarinoSao Tome and PrincipeSaudi ArabiaSenegalSerbiaSeychellesSierra LeoneSingaporeSlovak RepublicSloveniaSmall statesSolomon IslandsSouth AfricaSouth AsiaSouth Asia (IDA & IBRD)SpainSri LankaSt. Kitts and NevisSt. LuciaSt. Vincent and the GrenadinesSub-Saharan Africa Sub-Saharan Africa (excluding high income)Sub-Saharan Africa (IDA & IBRD countries)SudanSurinameSwazilandSwedenSwitzerlandSyrian Arab RepublicTajikistanTanzaniaThailandTimor-LesteTogoTongaTrinidad and TobagoTunisiaTurkeyTurkmenistanTuvaluUgandaUkraineUnited Arab EmiratesUnited KingdomUnited StatesUpper middle incomeUruguayUzbekistanVanuatuVenezuela, RBVietnamWest Bank and GazaWorldYemen, Rep.ZambiaZimbabwe Zeitlinie:
Diese Zeitleiste vorliegt die Graphik ab 1971 J. bis 2015 J. Nicaragua. Die Angaben bis 1970 J. sind nicht vorhanden. Die Zahl aktueller Beobachtungen nach Daten: 45.
Die Quelle (Bezeichnung):
Kennzahlen der Weltentwicklung
Die Quelle (Einrichtung):
World Bank staff estimates using data from the United Nations Statistics Division's National Accounts Statistics.
Kategorien:
Economy & Growth, Environment
Es wurde aktualisiert:
23 Apr 2017 Jahr
Kennzahlen der Wertänderungen vom Jahr zum Jahr
Minimum:
3.476
1 Jan 1971 Jahr
Maximum:
5.663
1 Jan 1986 Jahr
Zum Datum der Beobachtung
Wert
Absolute Veränderung
Die Veränderung bezüglich dem vorherigen Wert
1 Jan 1971 Jahr
3.476
+3.476
0.0%
1 Jan 1972 Jahr
3.497
+0.021
0.6%
1 Jan 1973 Jahr
3.72
+0.223
6.37%
1 Jan 1974 Jahr
3.913
+0.193
5.18%
1 Jan 1975 Jahr
4.094
+0.181
4.62%
1 Jan 1976 Jahr
4.444
+0.35
8.55%
1 Jan 1977 Jahr
4.366
-0.078
-1.76%
1 Jan 1978 Jahr
4.332
-0.033
-0.76%
1 Jan 1979 Jahr
4.162
-0.17
-3.93%
1 Jan 1980 Jahr
3.884
-0.278
-6.68%
1 Jan 1981 Jahr
5.063
+1.178
30.34%
1 Jan 1982 Jahr
5.21
+0.148
2.92%
1 Jan 1983 Jahr
5.12
-0.091
-1.74%
1 Jan 1984 Jahr
5.03
-0.09
-1.76%
1 Jan 1985 Jahr
5.177
+0.147
2.92%
1 Jan 1986 Jahr
5.663
+0.487
9.4%
1 Jan 1987 Jahr
5.196
-0.468
-8.25%
1 Jan 1988 Jahr
4.084
-1.112
-21.4%
1 Jan 1989 Jahr
4.523
+0.439
10.74%
1 Jan 1990 Jahr
4.756
+0.234
5.17%
1 Jan 1991 Jahr
3.843
-0.913
-19.21%
1 Jan 1992 Jahr
4.818
+0.975
25.38%
1 Jan 1993 Jahr
5.059
+0.241
5.0%
1 Jan 1994 Jahr
4.839
-0.22
-4.36%
1 Jan 1995 Jahr
4.052
-0.787
-16.26%
1 Jan 1996 Jahr
4.034
-0.018
-0.45%
1 Jan 1997 Jahr
3.812
-0.221
-5.49%
1 Jan 1998 Jahr
3.834
+0.021
0.56%
1 Jan 1999 Jahr
3.736
-0.097
-2.54%
1 Jan 2000 Jahr
3.989
+0.252
6.75%
1 Jan 2001 Jahr
3.645
-0.344
-8.63%
1 Jan 2002 Jahr
3.98
+0.335
9.2%
1 Jan 2003 Jahr
3.917
-0.063
-1.58%
1 Jan 2004 Jahr
3.976
+0.06
1.52%
1 Jan 2005 Jahr
3.983
+0.007
0.17%
1 Jan 2006 Jahr
3.759
-0.224
-5.63%
1 Jan 2007 Jahr
3.886
+0.127
3.37%
1 Jan 2008 Jahr
3.741
-0.145
-3.73%
1 Jan 2009 Jahr
3.51
-0.231
-6.17%
1 Jan 2010 Jahr
3.682
+0.172
4.91%
1 Jan 2011 Jahr
4.079
+0.397
10.78%
1 Jan 2012 Jahr
3.865
-0.214
-5.26%
1 Jan 2013 Jahr
4.387
+0.522
13.52%
1 Jan 2014 Jahr
4.526
+0.139
3.16%
1 Jan 2015 Jahr
4.242
-0.284
-6.28%
Bewertung der Länder gemäß mit laufender Statistik nach Jahren


Kommentare: