29
/de/
de
AIzaSyAYiBZKx7MnpbEhh9jyipgxe19OcubqV5w
April 1, 2024
121701
Dominican Republic
DOM
true
2
1
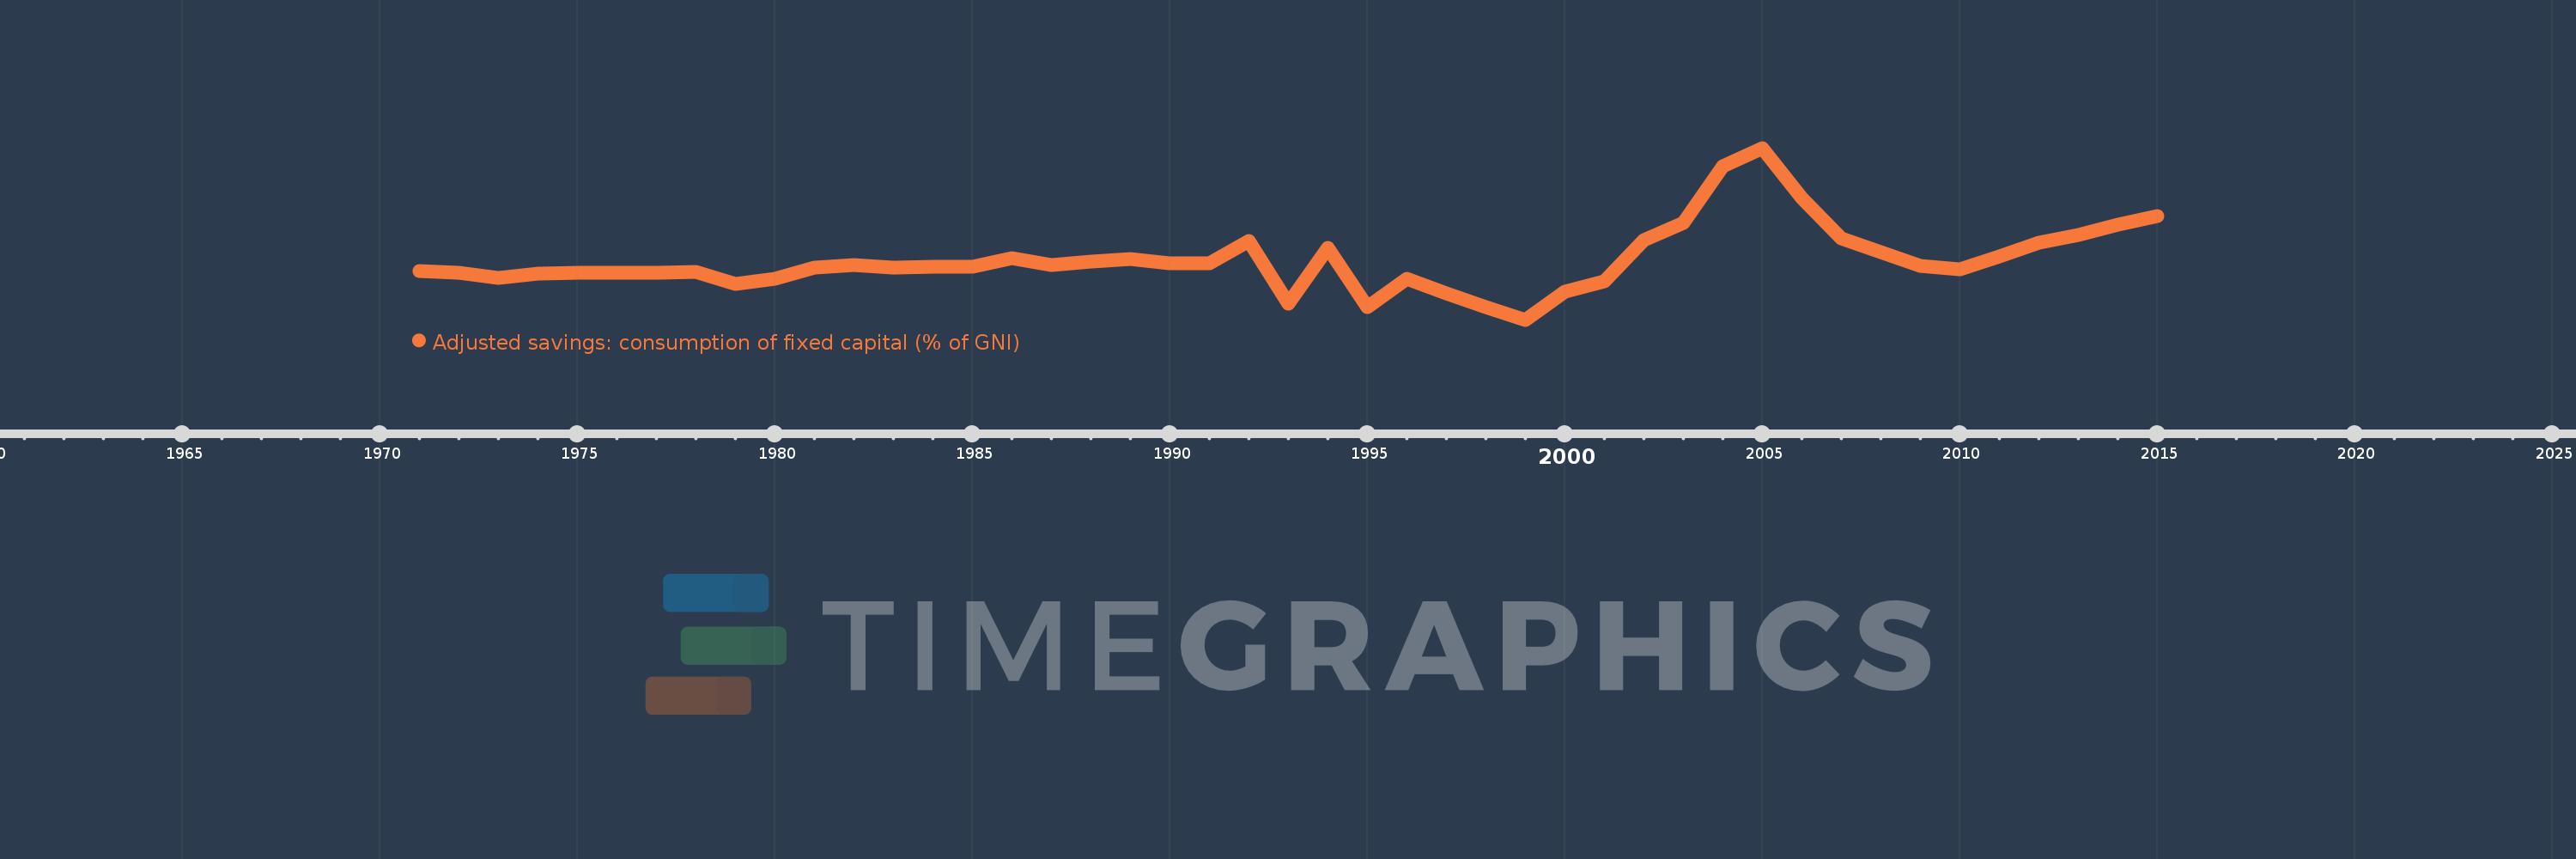
Adjusted savings: consumption of fixed capital (% of GNI)
2015,2014,2013,2012,2011,2010,2009,2008,2007,2006,2005,2004,2003,2002,2001,2000,1999,1998,1997,1996,1995,1994,1993,1992,1991,1990,1989,1988,1987,1986,1985,1984,1983,1982,1981,1980,1979,1978,1977,1976,1975,1974,1973,1972,1971
Diese Statistik in anderen Ländern:
AfghanistanAlbaniaAlgeriaAndorraAngolaAntigua and BarbudaArab WorldArgentinaArmeniaAustraliaAustriaAzerbaijanBahamas, TheBahrainBangladeshBarbadosBelarusBelgiumBelizeBeninBermudaBhutanBoliviaBosnia and HerzegovinaBotswanaBrazilBrunei DarussalamBulgariaBurkina FasoBurundiCabo VerdeCambodiaCameroonCanadaCaribbean small statesCentral African RepublicCentral Europe and the BalticsChadChileChinaColombiaComorosCongo, Dem. Rep.Congo, Rep.Costa RicaCote d'IvoireCroatiaCubaCyprusCzech RepublicDenmarkDjiboutiDominicaDominican RepublicEarly-demographic dividendEast Asia & PacificEast Asia & Pacific (excluding high income)East Asia & Pacific (IDA & IBRD countries)EcuadorEgypt, Arab Rep.El SalvadorEquatorial GuineaEritreaEstoniaEthiopiaEuro areaEurope & Central AsiaEurope & Central Asia (excluding high income)Europe & Central Asia (IDA & IBRD countries)European UnionFijiFinlandFragile and conflict affected situationsFranceGabonGambia, TheGeorgiaGermanyGhanaGreeceGreenlandGrenadaGuatemalaGuineaGuinea-BissauGuyanaHaitiHeavily indebted poor countries (HIPC)High incomeHondurasHong Kong SAR, ChinaHungaryIBRD onlyIcelandIDA & IBRD totalIDA blendIDA onlyIDA totalIndiaIndonesiaIran, Islamic Rep.IraqIrelandIsraelItalyJamaicaJapanJordanKazakhstanKenyaKiribatiKorea, Rep.KosovoKuwaitKyrgyz RepublicLao PDRLate-demographic dividendLatin America & Caribbean Latin America & Caribbean (excluding high income)Latin America & the Caribbean (IDA & IBRD countries)LatviaLeast developed countries: UN classificationLebanonLesothoLiberiaLibyaLiechtensteinLithuaniaLow & middle incomeLow incomeLower middle incomeLuxembourgMacao SAR, ChinaMacedonia, FYRMadagascarMalawiMalaysiaMaldivesMaliMaltaMarshall IslandsMauritaniaMauritiusMexicoMicronesia, Fed. Sts.Middle East & North AfricaMiddle East & North Africa (excluding high income)Middle East & North Africa (IDA & IBRD countries)Middle incomeMoldovaMonacoMongoliaMontenegroMoroccoMozambiqueMyanmarNamibiaNepalNetherlandsNew ZealandNicaraguaNigerNigeriaNorth AmericaNorwayOECD membersOmanOther small statesPacific island small statesPakistanPalauPanamaPapua New GuineaParaguayPeruPhilippinesPolandPortugalPost-demographic dividendPre-demographic dividendPuerto RicoQatarRomaniaRussian FederationRwandaSamoaSan MarinoSao Tome and PrincipeSaudi ArabiaSenegalSerbiaSeychellesSierra LeoneSingaporeSlovak RepublicSloveniaSmall statesSolomon IslandsSouth AfricaSouth AsiaSouth Asia (IDA & IBRD)SpainSri LankaSt. Kitts and NevisSt. LuciaSt. Vincent and the GrenadinesSub-Saharan Africa Sub-Saharan Africa (excluding high income)Sub-Saharan Africa (IDA & IBRD countries)SudanSurinameSwazilandSwedenSwitzerlandSyrian Arab RepublicTajikistanTanzaniaThailandTimor-LesteTogoTongaTrinidad and TobagoTunisiaTurkeyTurkmenistanTuvaluUgandaUkraineUnited Arab EmiratesUnited KingdomUnited StatesUpper middle incomeUruguayUzbekistanVanuatuVenezuela, RBVietnamWest Bank and GazaWorldYemen, Rep.ZambiaZimbabwe Zeitlinie:
Diese Zeitleiste vorliegt die Graphik ab 1971 J. bis 2015 J. Dominican Republic. Die Angaben bis 1970 J. sind nicht vorhanden. Die Zahl aktueller Beobachtungen nach Daten: 45.
Die Quelle (Bezeichnung):
Kennzahlen der Weltentwicklung
Die Quelle (Einrichtung):
World Bank staff estimates using data from the United Nations Statistics Division's National Accounts Statistics.
Kategorien:
Economy & Growth, Environment
Es wurde aktualisiert:
23 Apr 2017 Jahr
Kennzahlen der Wertänderungen vom Jahr zum Jahr
Minimum:
3.559
1 Jan 1999 Jahr
Maximum:
6.349
1 Jan 2005 Jahr
Zum Datum der Beobachtung
Wert
Absolute Veränderung
Die Veränderung bezüglich dem vorherigen Wert
1 Jan 1971 Jahr
4.345
+4.345
0.0%
1 Jan 1972 Jahr
4.326
-0.019
-0.43%
1 Jan 1973 Jahr
4.233
-0.093
-2.15%
1 Jan 1974 Jahr
4.309
+0.076
1.79%
1 Jan 1975 Jahr
4.323
+0.014
0.32%
1 Jan 1976 Jahr
4.323
+0.001
0.02%
1 Jan 1977 Jahr
4.327
+0.003
0.08%
1 Jan 1978 Jahr
4.34
+0.013
0.31%
1 Jan 1979 Jahr
4.141
-0.199
-4.57%
1 Jan 1980 Jahr
4.221
+0.079
1.92%
1 Jan 1981 Jahr
4.409
+0.188
4.47%
1 Jan 1982 Jahr
4.45
+0.04
0.91%
1 Jan 1983 Jahr
4.411
-0.039
-0.87%
1 Jan 1984 Jahr
4.422
+0.012
0.26%
1 Jan 1985 Jahr
4.423
+0.0
0.0%
1 Jan 1986 Jahr
4.558
+0.136
3.07%
1 Jan 1987 Jahr
4.447
-0.111
-2.44%
1 Jan 1988 Jahr
4.501
+0.053
1.2%
1 Jan 1989 Jahr
4.541
+0.041
0.9%
1 Jan 1990 Jahr
4.48
-0.062
-1.36%
1 Jan 1991 Jahr
4.469
-0.01
-0.23%
1 Jan 1992 Jahr
4.845
+0.376
8.41%
1 Jan 1993 Jahr
3.816
-1.029
-21.23%
1 Jan 1994 Jahr
4.73
+0.913
23.93%
1 Jan 1995 Jahr
3.758
-0.972
-20.55%
1 Jan 1996 Jahr
4.224
+0.466
12.41%
1 Jan 1997 Jahr
3.985
-0.239
-5.66%
1 Jan 1998 Jahr
3.765
-0.22
-5.51%
1 Jan 1999 Jahr
3.559
-0.206
-5.48%
1 Jan 2000 Jahr
4.013
+0.454
12.75%
1 Jan 2001 Jahr
4.179
+0.166
4.14%
1 Jan 2002 Jahr
4.847
+0.667
15.97%
1 Jan 2003 Jahr
5.131
+0.284
5.86%
1 Jan 2004 Jahr
6.05
+0.919
17.92%
1 Jan 2005 Jahr
6.349
+0.298
4.93%
1 Jan 2006 Jahr
5.534
-0.815
-12.83%
1 Jan 2007 Jahr
4.883
-0.651
-11.77%
1 Jan 2008 Jahr
4.663
-0.22
-4.51%
1 Jan 2009 Jahr
4.432
-0.231
-4.95%
1 Jan 2010 Jahr
4.372
-0.06
-1.36%
1 Jan 2011 Jahr
4.588
+0.216
4.94%
1 Jan 2012 Jahr
4.809
+0.222
4.83%
1 Jan 2013 Jahr
4.933
+0.124
2.57%
1 Jan 2014 Jahr
5.101
+0.168
3.41%
1 Jan 2015 Jahr
5.246
+0.145
2.85%
Bewertung der Länder gemäß mit laufender Statistik nach Jahren


Kommentare: