29
/de/
de
AIzaSyAYiBZKx7MnpbEhh9jyipgxe19OcubqV5w
April 1, 2024
127110
Equatorial Guinea
GNQ
true
2
1
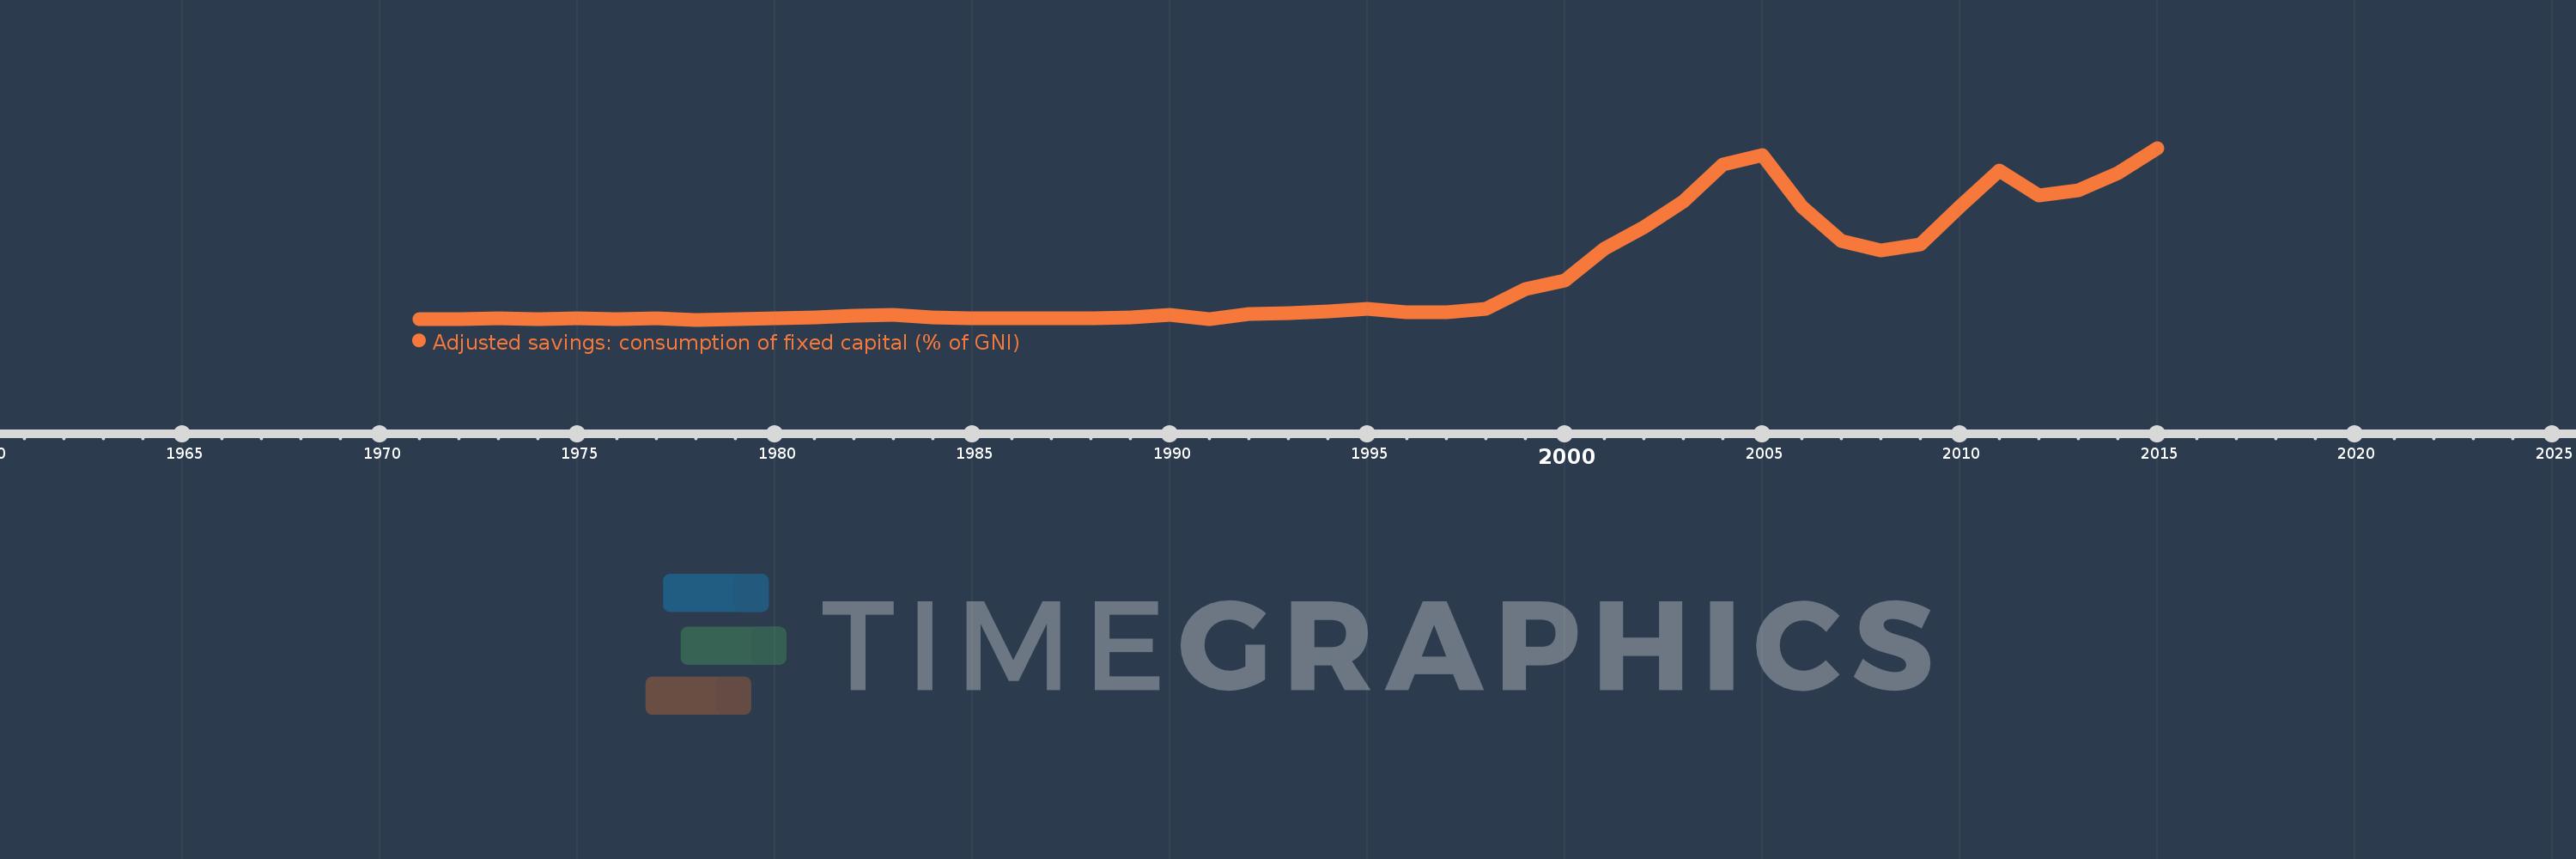
Adjusted savings: consumption of fixed capital (% of GNI)
2015,2014,2013,2012,2011,2010,2009,2008,2007,2006,2005,2004,2003,2002,2001,2000,1999,1998,1997,1996,1995,1994,1993,1992,1991,1990,1989,1988,1987,1986,1985,1984,1983,1982,1981,1978,1977,1976,1975,1974,1973,1972,1971
Diese Statistik in anderen Ländern:
AfghanistanAlbaniaAlgeriaAndorraAngolaAntigua and BarbudaArab WorldArgentinaArmeniaAustraliaAustriaAzerbaijanBahamas, TheBahrainBangladeshBarbadosBelarusBelgiumBelizeBeninBermudaBhutanBoliviaBosnia and HerzegovinaBotswanaBrazilBrunei DarussalamBulgariaBurkina FasoBurundiCabo VerdeCambodiaCameroonCanadaCaribbean small statesCentral African RepublicCentral Europe and the BalticsChadChileChinaColombiaComorosCongo, Dem. Rep.Congo, Rep.Costa RicaCote d'IvoireCroatiaCubaCyprusCzech RepublicDenmarkDjiboutiDominicaDominican RepublicEarly-demographic dividendEast Asia & PacificEast Asia & Pacific (excluding high income)East Asia & Pacific (IDA & IBRD countries)EcuadorEgypt, Arab Rep.El SalvadorEquatorial GuineaEritreaEstoniaEthiopiaEuro areaEurope & Central AsiaEurope & Central Asia (excluding high income)Europe & Central Asia (IDA & IBRD countries)European UnionFijiFinlandFragile and conflict affected situationsFranceGabonGambia, TheGeorgiaGermanyGhanaGreeceGreenlandGrenadaGuatemalaGuineaGuinea-BissauGuyanaHaitiHeavily indebted poor countries (HIPC)High incomeHondurasHong Kong SAR, ChinaHungaryIBRD onlyIcelandIDA & IBRD totalIDA blendIDA onlyIDA totalIndiaIndonesiaIran, Islamic Rep.IraqIrelandIsraelItalyJamaicaJapanJordanKazakhstanKenyaKiribatiKorea, Rep.KosovoKuwaitKyrgyz RepublicLao PDRLate-demographic dividendLatin America & Caribbean Latin America & Caribbean (excluding high income)Latin America & the Caribbean (IDA & IBRD countries)LatviaLeast developed countries: UN classificationLebanonLesothoLiberiaLibyaLiechtensteinLithuaniaLow & middle incomeLow incomeLower middle incomeLuxembourgMacao SAR, ChinaMacedonia, FYRMadagascarMalawiMalaysiaMaldivesMaliMaltaMarshall IslandsMauritaniaMauritiusMexicoMicronesia, Fed. Sts.Middle East & North AfricaMiddle East & North Africa (excluding high income)Middle East & North Africa (IDA & IBRD countries)Middle incomeMoldovaMonacoMongoliaMontenegroMoroccoMozambiqueMyanmarNamibiaNepalNetherlandsNew ZealandNicaraguaNigerNigeriaNorth AmericaNorwayOECD membersOmanOther small statesPacific island small statesPakistanPalauPanamaPapua New GuineaParaguayPeruPhilippinesPolandPortugalPost-demographic dividendPre-demographic dividendPuerto RicoQatarRomaniaRussian FederationRwandaSamoaSan MarinoSao Tome and PrincipeSaudi ArabiaSenegalSerbiaSeychellesSierra LeoneSingaporeSlovak RepublicSloveniaSmall statesSolomon IslandsSouth AfricaSouth AsiaSouth Asia (IDA & IBRD)SpainSri LankaSt. Kitts and NevisSt. LuciaSt. Vincent and the GrenadinesSub-Saharan Africa Sub-Saharan Africa (excluding high income)Sub-Saharan Africa (IDA & IBRD countries)SudanSurinameSwazilandSwedenSwitzerlandSyrian Arab RepublicTajikistanTanzaniaThailandTimor-LesteTogoTongaTrinidad and TobagoTunisiaTurkeyTurkmenistanTuvaluUgandaUkraineUnited Arab EmiratesUnited KingdomUnited StatesUpper middle incomeUruguayUzbekistanVanuatuVenezuela, RBVietnamWest Bank and GazaWorldYemen, Rep.ZambiaZimbabwe Zeitlinie:
Diese Zeitleiste vorliegt die Graphik ab 1971 J. bis 2015 J. Equatorial Guinea. Die Angaben bis 1970 J. sind nicht vorhanden. Die Zahl aktueller Beobachtungen nach Daten: 43.
Die Quelle (Bezeichnung):
Kennzahlen der Weltentwicklung
Die Quelle (Einrichtung):
World Bank staff estimates using data from the United Nations Statistics Division's National Accounts Statistics.
Kategorien:
Economy & Growth, Environment
Es wurde aktualisiert:
23 Apr 2017 Jahr
Kennzahlen der Wertänderungen vom Jahr zum Jahr
Minimum:
0.699
1 Jan 1978 Jahr
Maximum:
8.413
1 Jan 2015 Jahr
Zum Datum der Beobachtung
Wert
Absolute Veränderung
Die Veränderung bezüglich dem vorherigen Wert
1 Jan 1971 Jahr
0.712
+0.712
0.0%
1 Jan 1972 Jahr
0.72
+0.008
1.07%
1 Jan 1973 Jahr
0.752
+0.032
4.43%
1 Jan 1974 Jahr
0.742
-0.01
-1.3%
1 Jan 1975 Jahr
0.751
+0.009
1.26%
1 Jan 1976 Jahr
0.728
-0.023
-3.1%
1 Jan 1977 Jahr
0.748
+0.02
2.78%
1 Jan 1978 Jahr
0.699
-0.049
-6.58%
1 Jan 1981 Jahr
0.799
+0.1
14.29%
1 Jan 1982 Jahr
0.886
+0.087
10.91%
1 Jan 1983 Jahr
0.93
+0.043
4.91%
1 Jan 1984 Jahr
0.796
-0.133
-14.34%
1 Jan 1985 Jahr
0.772
-0.025
-3.1%
1 Jan 1986 Jahr
0.758
-0.014
-1.78%
1 Jan 1987 Jahr
0.78
+0.022
2.97%
1 Jan 1988 Jahr
0.768
-0.012
-1.53%
1 Jan 1989 Jahr
0.787
+0.019
2.46%
1 Jan 1990 Jahr
0.901
+0.114
14.43%
1 Jan 1991 Jahr
0.714
-0.187
-20.73%
1 Jan 1992 Jahr
0.975
+0.26
36.47%
1 Jan 1993 Jahr
1.015
+0.04
4.13%
1 Jan 1994 Jahr
1.085
+0.07
6.89%
1 Jan 1995 Jahr
1.188
+0.104
9.56%
1 Jan 1996 Jahr
1.04
-0.148
-12.49%
1 Jan 1997 Jahr
1.032
-0.008
-0.79%
1 Jan 1998 Jahr
1.188
+0.156
15.14%
1 Jan 1999 Jahr
2.082
+0.894
75.24%
1 Jan 2000 Jahr
2.473
+0.391
18.76%
1 Jan 2001 Jahr
3.901
+1.429
57.79%
1 Jan 2002 Jahr
4.855
+0.954
24.45%
1 Jan 2003 Jahr
6.007
+1.152
23.73%
1 Jan 2004 Jahr
7.687
+1.68
27.96%
1 Jan 2005 Jahr
8.111
+0.424
5.51%
1 Jan 2006 Jahr
5.777
-2.334
-28.78%
1 Jan 2007 Jahr
4.234
-1.543
-26.7%
1 Jan 2008 Jahr
3.825
-0.409
-9.66%
1 Jan 2009 Jahr
4.077
+0.252
6.59%
1 Jan 2010 Jahr
5.788
+1.711
41.95%
1 Jan 2011 Jahr
7.412
+1.624
28.06%
1 Jan 2012 Jahr
6.263
-1.149
-15.5%
1 Jan 2013 Jahr
6.499
+0.236
3.77%
1 Jan 2014 Jahr
7.299
+0.8
12.31%
1 Jan 2015 Jahr
8.413
+1.114
15.26%
Bewertung der Länder gemäß mit laufender Statistik nach Jahren


Kommentare: