29
/de/
de
AIzaSyAYiBZKx7MnpbEhh9jyipgxe19OcubqV5w
April 1, 2024
111818
Costa Rica
CRI
true
2
1
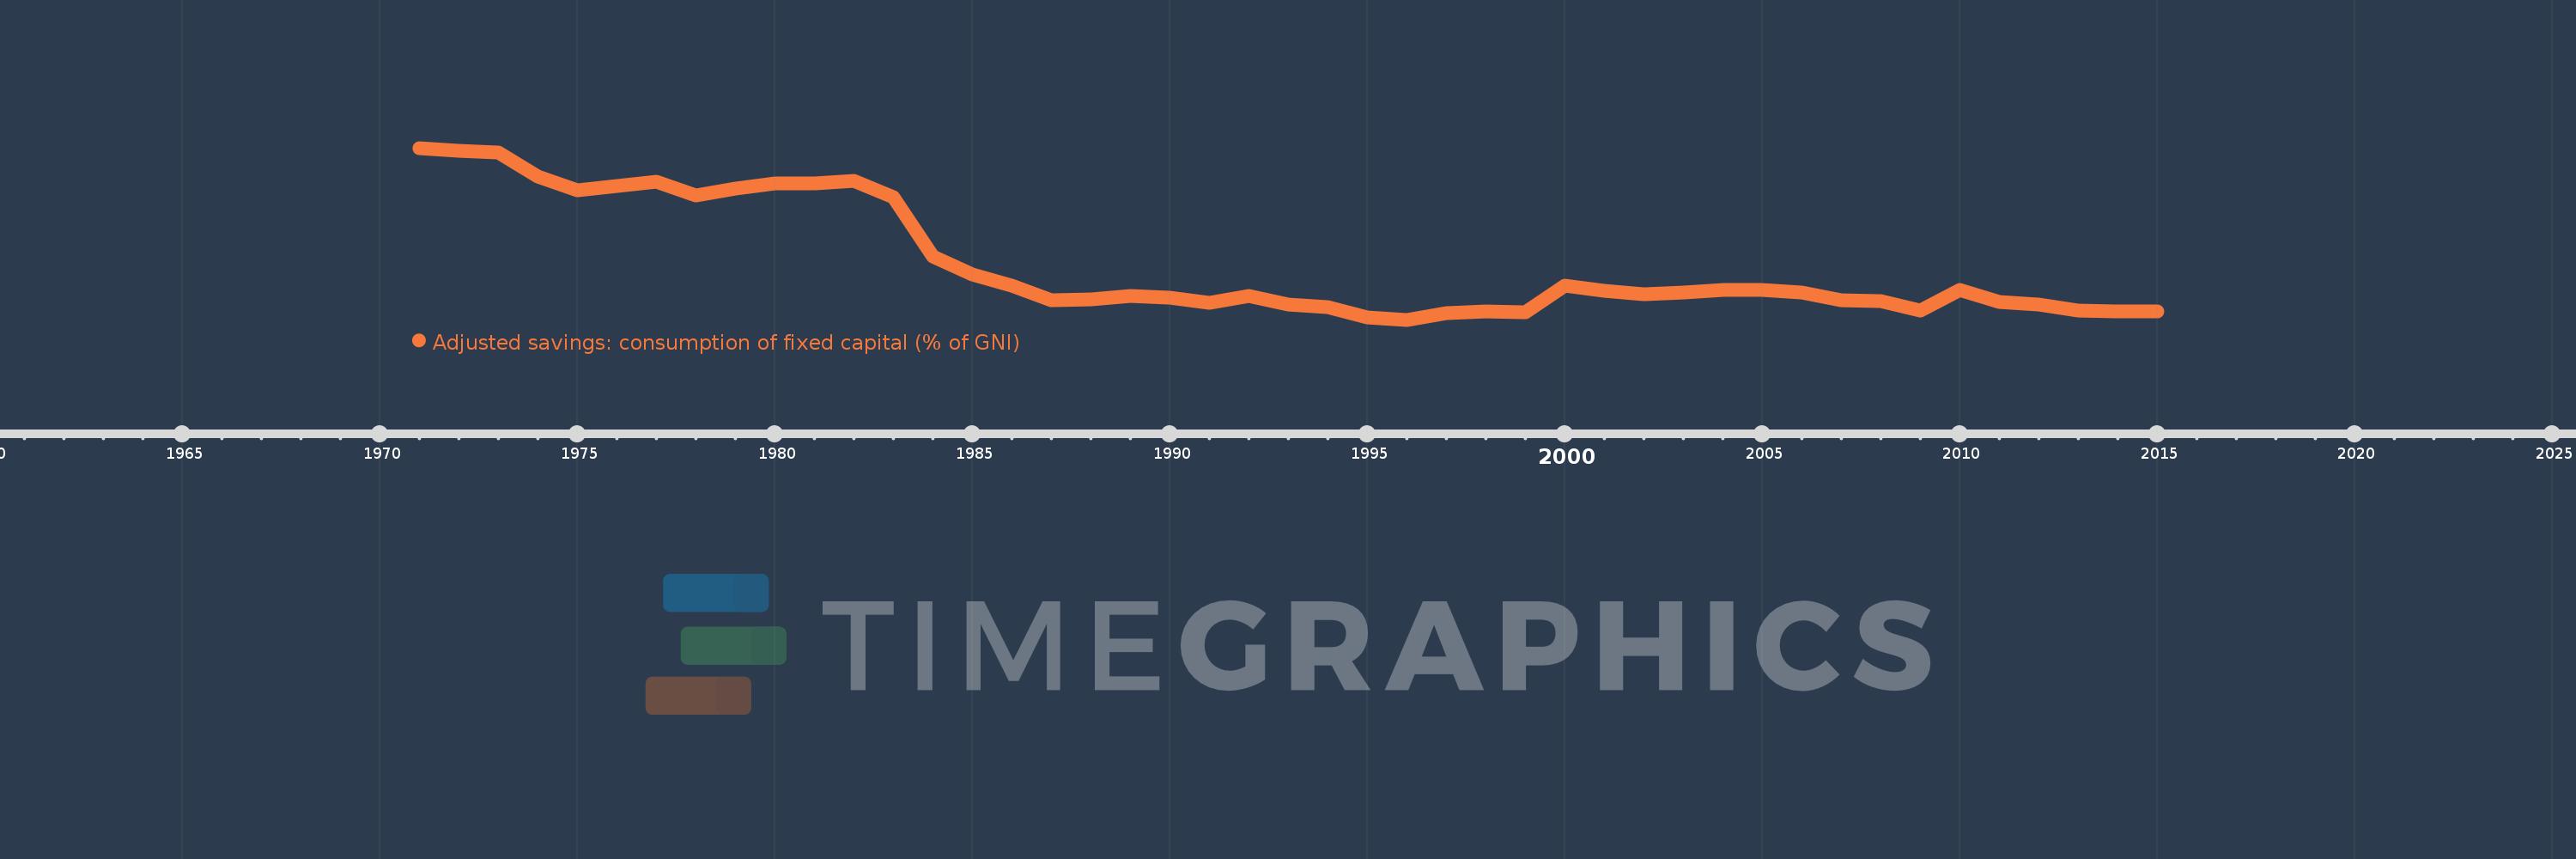
Adjusted savings: consumption of fixed capital (% of GNI)
2015,2014,2013,2012,2011,2010,2009,2008,2007,2006,2005,2004,2003,2002,2001,2000,1999,1998,1997,1996,1995,1994,1993,1992,1991,1990,1989,1988,1987,1986,1985,1984,1983,1982,1981,1980,1979,1978,1977,1976,1975,1974,1973,1972,1971
Diese Statistik in anderen Ländern:
AfghanistanAlbaniaAlgeriaAndorraAngolaAntigua and BarbudaArab WorldArgentinaArmeniaAustraliaAustriaAzerbaijanBahamas, TheBahrainBangladeshBarbadosBelarusBelgiumBelizeBeninBermudaBhutanBoliviaBosnia and HerzegovinaBotswanaBrazilBrunei DarussalamBulgariaBurkina FasoBurundiCabo VerdeCambodiaCameroonCanadaCaribbean small statesCentral African RepublicCentral Europe and the BalticsChadChileChinaColombiaComorosCongo, Dem. Rep.Congo, Rep.Costa RicaCote d'IvoireCroatiaCubaCyprusCzech RepublicDenmarkDjiboutiDominicaDominican RepublicEarly-demographic dividendEast Asia & PacificEast Asia & Pacific (excluding high income)East Asia & Pacific (IDA & IBRD countries)EcuadorEgypt, Arab Rep.El SalvadorEquatorial GuineaEritreaEstoniaEthiopiaEuro areaEurope & Central AsiaEurope & Central Asia (excluding high income)Europe & Central Asia (IDA & IBRD countries)European UnionFijiFinlandFragile and conflict affected situationsFranceGabonGambia, TheGeorgiaGermanyGhanaGreeceGreenlandGrenadaGuatemalaGuineaGuinea-BissauGuyanaHaitiHeavily indebted poor countries (HIPC)High incomeHondurasHong Kong SAR, ChinaHungaryIBRD onlyIcelandIDA & IBRD totalIDA blendIDA onlyIDA totalIndiaIndonesiaIran, Islamic Rep.IraqIrelandIsraelItalyJamaicaJapanJordanKazakhstanKenyaKiribatiKorea, Rep.KosovoKuwaitKyrgyz RepublicLao PDRLate-demographic dividendLatin America & Caribbean Latin America & Caribbean (excluding high income)Latin America & the Caribbean (IDA & IBRD countries)LatviaLeast developed countries: UN classificationLebanonLesothoLiberiaLibyaLiechtensteinLithuaniaLow & middle incomeLow incomeLower middle incomeLuxembourgMacao SAR, ChinaMacedonia, FYRMadagascarMalawiMalaysiaMaldivesMaliMaltaMarshall IslandsMauritaniaMauritiusMexicoMicronesia, Fed. Sts.Middle East & North AfricaMiddle East & North Africa (excluding high income)Middle East & North Africa (IDA & IBRD countries)Middle incomeMoldovaMonacoMongoliaMontenegroMoroccoMozambiqueMyanmarNamibiaNepalNetherlandsNew ZealandNicaraguaNigerNigeriaNorth AmericaNorwayOECD membersOmanOther small statesPacific island small statesPakistanPalauPanamaPapua New GuineaParaguayPeruPhilippinesPolandPortugalPost-demographic dividendPre-demographic dividendPuerto RicoQatarRomaniaRussian FederationRwandaSamoaSan MarinoSao Tome and PrincipeSaudi ArabiaSenegalSerbiaSeychellesSierra LeoneSingaporeSlovak RepublicSloveniaSmall statesSolomon IslandsSouth AfricaSouth AsiaSouth Asia (IDA & IBRD)SpainSri LankaSt. Kitts and NevisSt. LuciaSt. Vincent and the GrenadinesSub-Saharan Africa Sub-Saharan Africa (excluding high income)Sub-Saharan Africa (IDA & IBRD countries)SudanSurinameSwazilandSwedenSwitzerlandSyrian Arab RepublicTajikistanTanzaniaThailandTimor-LesteTogoTongaTrinidad and TobagoTunisiaTurkeyTurkmenistanTuvaluUgandaUkraineUnited Arab EmiratesUnited KingdomUnited StatesUpper middle incomeUruguayUzbekistanVanuatuVenezuela, RBVietnamWest Bank and GazaWorldYemen, Rep.ZambiaZimbabwe Zeitlinie:
Diese Zeitleiste vorliegt die Graphik ab 1971 J. bis 2015 J. Costa Rica. Die Angaben bis 1970 J. sind nicht vorhanden. Die Zahl aktueller Beobachtungen nach Daten: 45.
Die Quelle (Bezeichnung):
Kennzahlen der Weltentwicklung
Die Quelle (Einrichtung):
World Bank staff estimates using data from the United Nations Statistics Division's National Accounts Statistics.
Kategorien:
Economy & Growth, Environment
Es wurde aktualisiert:
23 Apr 2017 Jahr
Kennzahlen der Wertänderungen vom Jahr zum Jahr
Minimum:
5.57
1 Jan 1996 Jahr
Maximum:
9.793
1 Jan 1971 Jahr
Zum Datum der Beobachtung
Wert
Absolute Veränderung
Die Veränderung bezüglich dem vorherigen Wert
1 Jan 1971 Jahr
9.793
+9.793
0.0%
1 Jan 1972 Jahr
9.72
-0.074
-0.75%
1 Jan 1973 Jahr
9.689
-0.031
-0.32%
1 Jan 1974 Jahr
9.082
-0.607
-6.26%
1 Jan 1975 Jahr
8.761
-0.321
-3.53%
1 Jan 1976 Jahr
8.867
+0.105
1.2%
1 Jan 1977 Jahr
8.973
+0.107
1.2%
1 Jan 1978 Jahr
8.619
-0.354
-3.95%
1 Jan 1979 Jahr
8.789
+0.171
1.98%
1 Jan 1980 Jahr
8.93
+0.14
1.6%
1 Jan 1981 Jahr
8.927
-0.002
-0.03%
1 Jan 1982 Jahr
8.981
+0.053
0.6%
1 Jan 1983 Jahr
8.576
-0.405
-4.51%
1 Jan 1984 Jahr
7.122
-1.454
-16.96%
1 Jan 1985 Jahr
6.683
-0.439
-6.16%
1 Jan 1986 Jahr
6.409
-0.273
-4.09%
1 Jan 1987 Jahr
6.045
-0.365
-5.69%
1 Jan 1988 Jahr
6.065
+0.021
0.34%
1 Jan 1989 Jahr
6.151
+0.085
1.41%
1 Jan 1990 Jahr
6.112
-0.039
-0.63%
1 Jan 1991 Jahr
5.992
-0.119
-1.95%
1 Jan 1992 Jahr
6.15
+0.158
2.63%
1 Jan 1993 Jahr
5.953
-0.196
-3.19%
1 Jan 1994 Jahr
5.886
-0.068
-1.14%
1 Jan 1995 Jahr
5.632
-0.254
-4.32%
1 Jan 1996 Jahr
5.57
-0.062
-1.1%
1 Jan 1997 Jahr
5.723
+0.153
2.75%
1 Jan 1998 Jahr
5.766
+0.044
0.76%
1 Jan 1999 Jahr
5.757
-0.01
-0.17%
1 Jan 2000 Jahr
6.415
+0.658
11.43%
1 Jan 2001 Jahr
6.276
-0.139
-2.16%
1 Jan 2002 Jahr
6.187
-0.089
-1.42%
1 Jan 2003 Jahr
6.237
+0.05
0.8%
1 Jan 2004 Jahr
6.305
+0.068
1.09%
1 Jan 2005 Jahr
6.301
-0.004
-0.06%
1 Jan 2006 Jahr
6.233
-0.068
-1.07%
1 Jan 2007 Jahr
6.059
-0.174
-2.79%
1 Jan 2008 Jahr
6.03
-0.03
-0.49%
1 Jan 2009 Jahr
5.793
-0.237
-3.93%
1 Jan 2010 Jahr
6.301
+0.508
8.77%
1 Jan 2011 Jahr
6.008
-0.293
-4.64%
1 Jan 2012 Jahr
5.939
-0.069
-1.15%
1 Jan 2013 Jahr
5.788
-0.151
-2.55%
1 Jan 2014 Jahr
5.769
-0.019
-0.33%
1 Jan 2015 Jahr
5.771
+0.003
0.05%
Bewertung der Länder gemäß mit laufender Statistik nach Jahren


Kommentare: