29
/de/
de
AIzaSyAYiBZKx7MnpbEhh9jyipgxe19OcubqV5w
April 1, 2024
138963
Germany
DEU
true
2
1
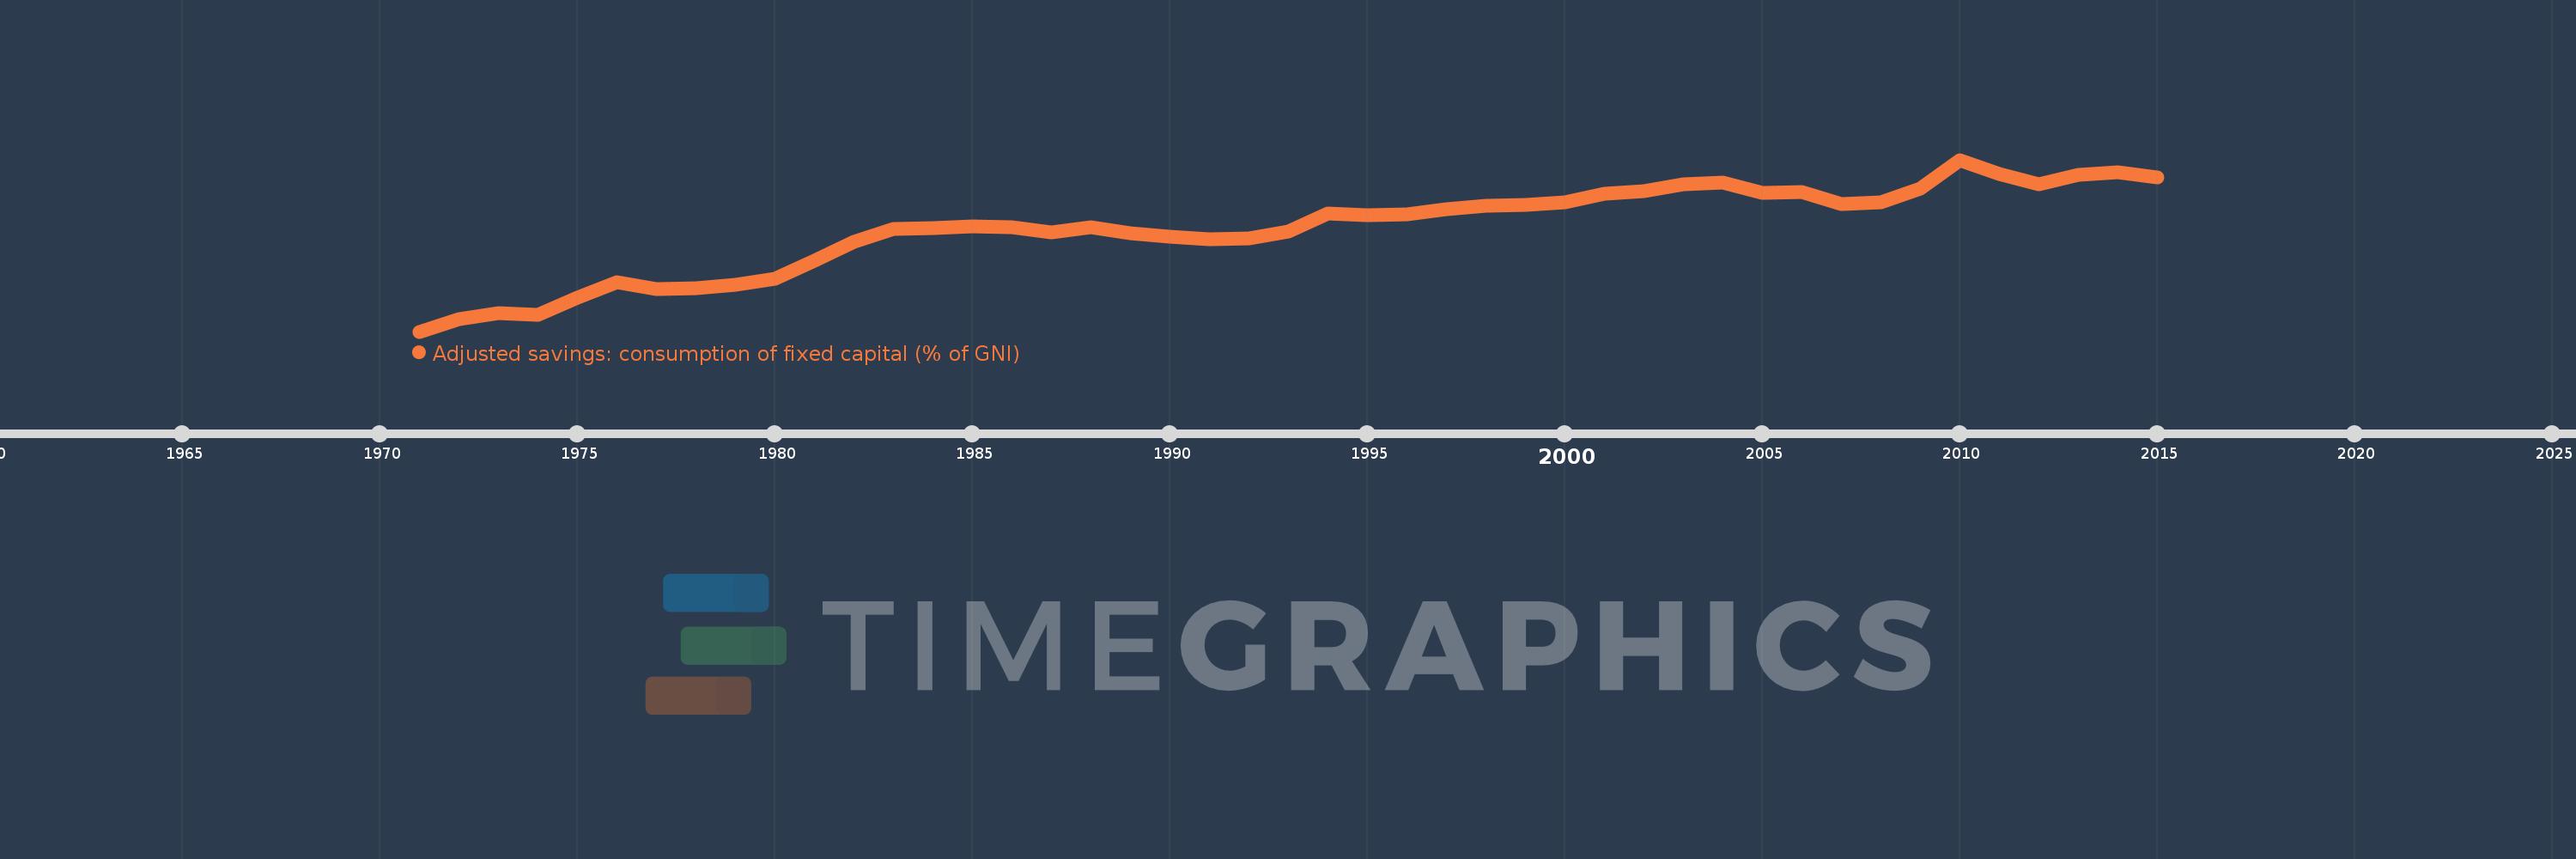
Adjusted savings: consumption of fixed capital (% of GNI)
2015,2014,2013,2012,2011,2010,2009,2008,2007,2006,2005,2004,2003,2002,2001,2000,1999,1998,1997,1996,1995,1994,1993,1992,1991,1990,1989,1988,1987,1986,1985,1984,1983,1982,1981,1980,1979,1978,1977,1976,1975,1974,1973,1972,1971
Diese Statistik in anderen Ländern:
AfghanistanAlbaniaAlgeriaAndorraAngolaAntigua and BarbudaArab WorldArgentinaArmeniaAustraliaAustriaAzerbaijanBahamas, TheBahrainBangladeshBarbadosBelarusBelgiumBelizeBeninBermudaBhutanBoliviaBosnia and HerzegovinaBotswanaBrazilBrunei DarussalamBulgariaBurkina FasoBurundiCabo VerdeCambodiaCameroonCanadaCaribbean small statesCentral African RepublicCentral Europe and the BalticsChadChileChinaColombiaComorosCongo, Dem. Rep.Congo, Rep.Costa RicaCote d'IvoireCroatiaCubaCyprusCzech RepublicDenmarkDjiboutiDominicaDominican RepublicEarly-demographic dividendEast Asia & PacificEast Asia & Pacific (excluding high income)East Asia & Pacific (IDA & IBRD countries)EcuadorEgypt, Arab Rep.El SalvadorEquatorial GuineaEritreaEstoniaEthiopiaEuro areaEurope & Central AsiaEurope & Central Asia (excluding high income)Europe & Central Asia (IDA & IBRD countries)European UnionFijiFinlandFragile and conflict affected situationsFranceGabonGambia, TheGeorgiaGermanyGhanaGreeceGreenlandGrenadaGuatemalaGuineaGuinea-BissauGuyanaHaitiHeavily indebted poor countries (HIPC)High incomeHondurasHong Kong SAR, ChinaHungaryIBRD onlyIcelandIDA & IBRD totalIDA blendIDA onlyIDA totalIndiaIndonesiaIran, Islamic Rep.IraqIrelandIsraelItalyJamaicaJapanJordanKazakhstanKenyaKiribatiKorea, Rep.KosovoKuwaitKyrgyz RepublicLao PDRLate-demographic dividendLatin America & Caribbean Latin America & Caribbean (excluding high income)Latin America & the Caribbean (IDA & IBRD countries)LatviaLeast developed countries: UN classificationLebanonLesothoLiberiaLibyaLiechtensteinLithuaniaLow & middle incomeLow incomeLower middle incomeLuxembourgMacao SAR, ChinaMacedonia, FYRMadagascarMalawiMalaysiaMaldivesMaliMaltaMarshall IslandsMauritaniaMauritiusMexicoMicronesia, Fed. Sts.Middle East & North AfricaMiddle East & North Africa (excluding high income)Middle East & North Africa (IDA & IBRD countries)Middle incomeMoldovaMonacoMongoliaMontenegroMoroccoMozambiqueMyanmarNamibiaNepalNetherlandsNew ZealandNicaraguaNigerNigeriaNorth AmericaNorwayOECD membersOmanOther small statesPacific island small statesPakistanPalauPanamaPapua New GuineaParaguayPeruPhilippinesPolandPortugalPost-demographic dividendPre-demographic dividendPuerto RicoQatarRomaniaRussian FederationRwandaSamoaSan MarinoSao Tome and PrincipeSaudi ArabiaSenegalSerbiaSeychellesSierra LeoneSingaporeSlovak RepublicSloveniaSmall statesSolomon IslandsSouth AfricaSouth AsiaSouth Asia (IDA & IBRD)SpainSri LankaSt. Kitts and NevisSt. LuciaSt. Vincent and the GrenadinesSub-Saharan Africa Sub-Saharan Africa (excluding high income)Sub-Saharan Africa (IDA & IBRD countries)SudanSurinameSwazilandSwedenSwitzerlandSyrian Arab RepublicTajikistanTanzaniaThailandTimor-LesteTogoTongaTrinidad and TobagoTunisiaTurkeyTurkmenistanTuvaluUgandaUkraineUnited Arab EmiratesUnited KingdomUnited StatesUpper middle incomeUruguayUzbekistanVanuatuVenezuela, RBVietnamWest Bank and GazaWorldYemen, Rep.ZambiaZimbabwe Zeitlinie:
Diese Zeitleiste vorliegt die Graphik ab 1971 J. bis 2015 J. Germany. Die Angaben bis 1970 J. sind nicht vorhanden. Die Zahl aktueller Beobachtungen nach Daten: 45.
Die Quelle (Bezeichnung):
Kennzahlen der Weltentwicklung
Die Quelle (Einrichtung):
World Bank staff estimates using data from the United Nations Statistics Division's National Accounts Statistics.
Kategorien:
Economy & Growth, Environment
Es wurde aktualisiert:
23 Apr 2017 Jahr
Kennzahlen der Wertänderungen vom Jahr zum Jahr
Minimum:
12.554
1 Jan 1971 Jahr
Maximum:
17.92
1 Jan 2010 Jahr
Zum Datum der Beobachtung
Wert
Absolute Veränderung
Die Veränderung bezüglich dem vorherigen Wert
1 Jan 1971 Jahr
12.554
+12.554
0.0%
1 Jan 1972 Jahr
12.942
+0.388
3.09%
1 Jan 1973 Jahr
13.134
+0.192
1.48%
1 Jan 1974 Jahr
13.064
-0.07
-0.54%
1 Jan 1975 Jahr
13.601
+0.537
4.11%
1 Jan 1976 Jahr
14.089
+0.488
3.58%
1 Jan 1977 Jahr
13.872
-0.216
-1.53%
1 Jan 1978 Jahr
13.896
+0.024
0.17%
1 Jan 1979 Jahr
14.025
+0.129
0.93%
1 Jan 1980 Jahr
14.198
+0.172
1.23%
1 Jan 1981 Jahr
14.769
+0.572
4.03%
1 Jan 1982 Jahr
15.36
+0.591
4.0%
1 Jan 1983 Jahr
15.753
+0.393
2.56%
1 Jan 1984 Jahr
15.798
+0.045
0.28%
1 Jan 1985 Jahr
15.841
+0.044
0.28%
1 Jan 1986 Jahr
15.808
-0.033
-0.21%
1 Jan 1987 Jahr
15.647
-0.161
-1.02%
1 Jan 1988 Jahr
15.824
+0.176
1.13%
1 Jan 1989 Jahr
15.62
-0.203
-1.29%
1 Jan 1990 Jahr
15.507
-0.113
-0.73%
1 Jan 1991 Jahr
15.426
-0.081
-0.52%
1 Jan 1992 Jahr
15.463
+0.037
0.24%
1 Jan 1993 Jahr
15.68
+0.217
1.4%
1 Jan 1994 Jahr
16.238
+0.558
3.56%
1 Jan 1995 Jahr
16.199
-0.038
-0.23%
1 Jan 1996 Jahr
16.221
+0.022
0.14%
1 Jan 1997 Jahr
16.372
+0.151
0.93%
1 Jan 1998 Jahr
16.482
+0.11
0.67%
1 Jan 1999 Jahr
16.518
+0.036
0.22%
1 Jan 2000 Jahr
16.588
+0.069
0.42%
1 Jan 2001 Jahr
16.855
+0.267
1.61%
1 Jan 2002 Jahr
16.946
+0.091
0.54%
1 Jan 2003 Jahr
17.16
+0.214
1.26%
1 Jan 2004 Jahr
17.214
+0.054
0.31%
1 Jan 2005 Jahr
16.877
-0.337
-1.96%
1 Jan 2006 Jahr
16.922
+0.045
0.27%
1 Jan 2007 Jahr
16.546
-0.376
-2.22%
1 Jan 2008 Jahr
16.588
+0.042
0.25%
1 Jan 2009 Jahr
17.024
+0.435
2.62%
1 Jan 2010 Jahr
17.92
+0.897
5.27%
1 Jan 2011 Jahr
17.474
-0.446
-2.49%
1 Jan 2012 Jahr
17.159
-0.315
-1.8%
1 Jan 2013 Jahr
17.451
+0.292
1.7%
1 Jan 2014 Jahr
17.525
+0.074
0.42%
1 Jan 2015 Jahr
17.36
-0.165
-0.94%
Bewertung der Länder gemäß mit laufender Statistik nach Jahren


Kommentare: