29
/de/
de
AIzaSyAYiBZKx7MnpbEhh9jyipgxe19OcubqV5w
April 1, 2024
207634
Netherlands
NLD
true
2
1
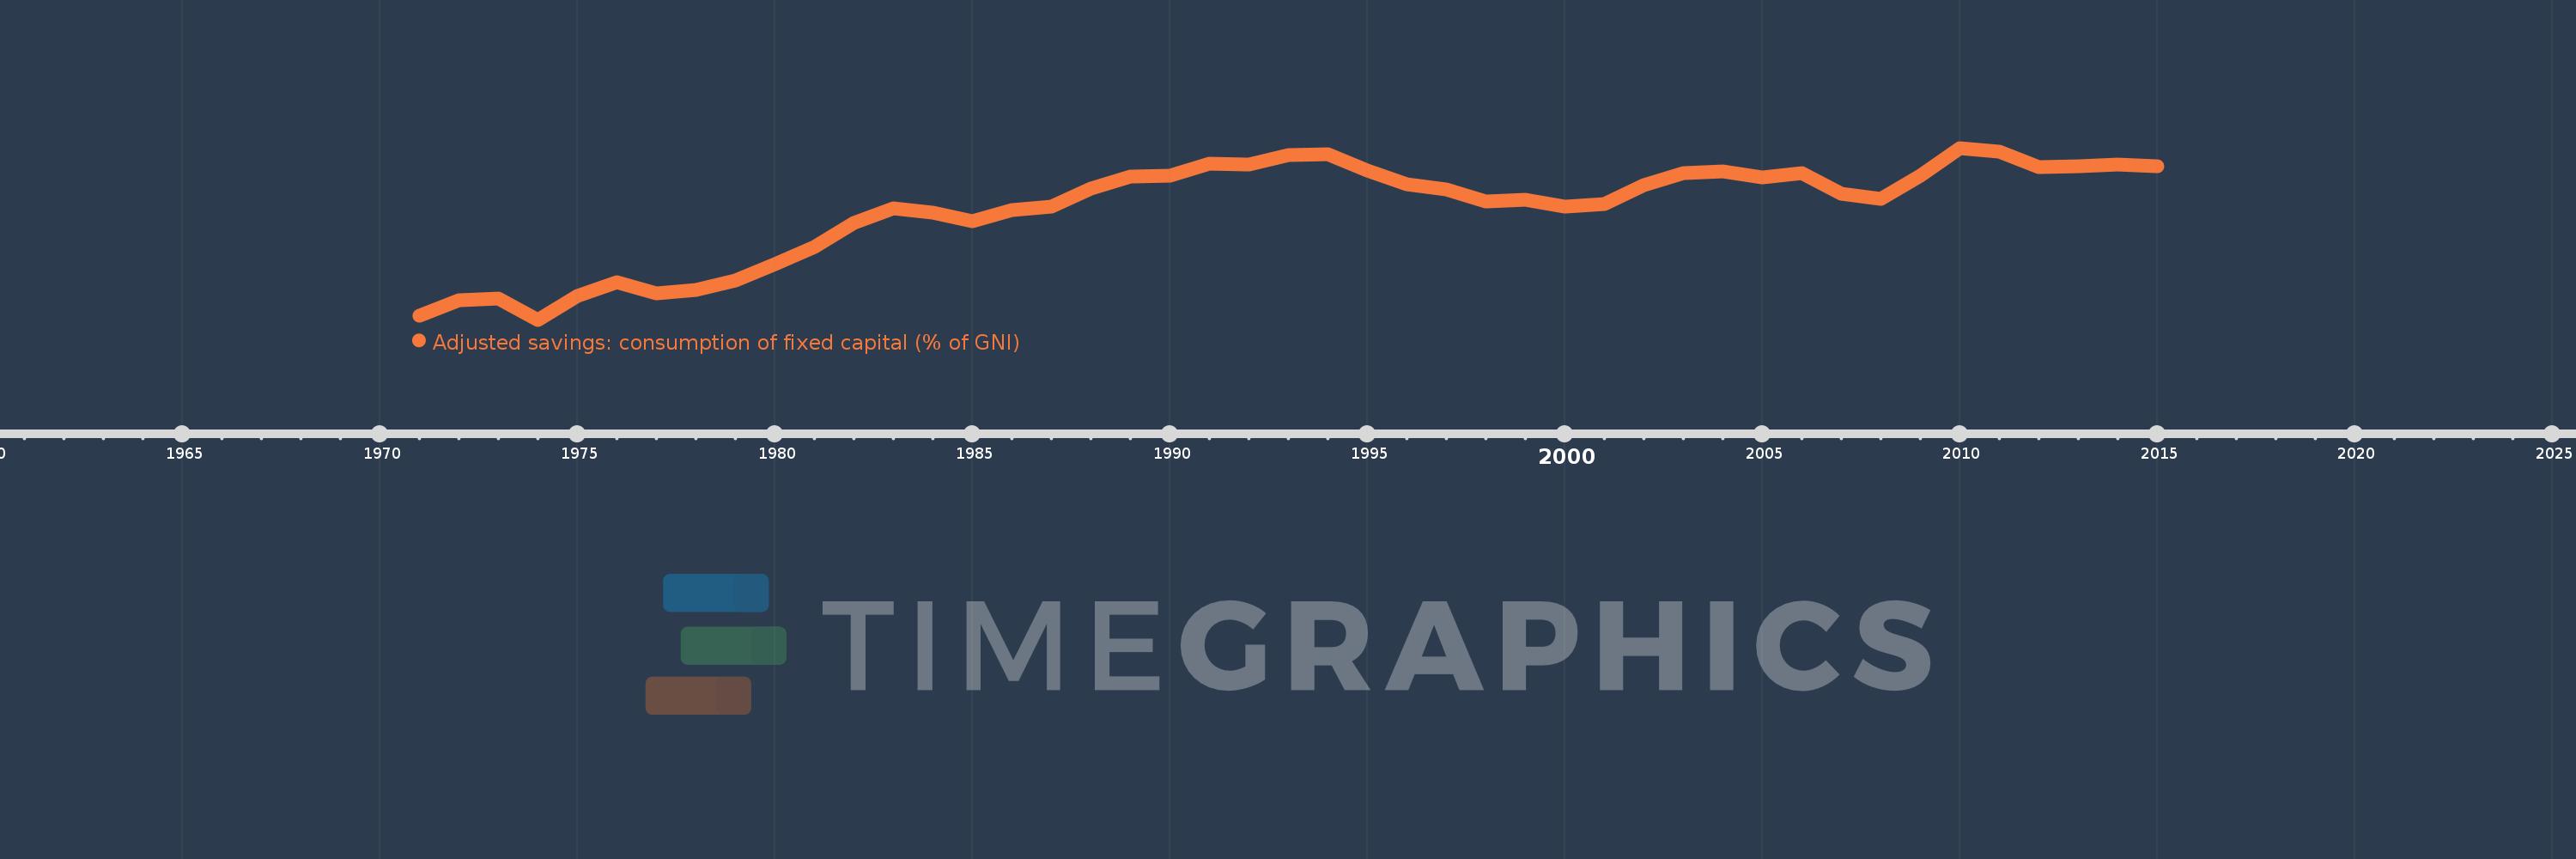
Adjusted savings: consumption of fixed capital (% of GNI)
2015,2014,2013,2012,2011,2010,2009,2008,2007,2006,2005,2004,2003,2002,2001,2000,1999,1998,1997,1996,1995,1994,1993,1992,1991,1990,1989,1988,1987,1986,1985,1984,1983,1982,1981,1980,1979,1978,1977,1976,1975,1974,1973,1972,1971
Diese Statistik in anderen Ländern:
AfghanistanAlbaniaAlgeriaAndorraAngolaAntigua and BarbudaArab WorldArgentinaArmeniaAustraliaAustriaAzerbaijanBahamas, TheBahrainBangladeshBarbadosBelarusBelgiumBelizeBeninBermudaBhutanBoliviaBosnia and HerzegovinaBotswanaBrazilBrunei DarussalamBulgariaBurkina FasoBurundiCabo VerdeCambodiaCameroonCanadaCaribbean small statesCentral African RepublicCentral Europe and the BalticsChadChileChinaColombiaComorosCongo, Dem. Rep.Congo, Rep.Costa RicaCote d'IvoireCroatiaCubaCyprusCzech RepublicDenmarkDjiboutiDominicaDominican RepublicEarly-demographic dividendEast Asia & PacificEast Asia & Pacific (excluding high income)East Asia & Pacific (IDA & IBRD countries)EcuadorEgypt, Arab Rep.El SalvadorEquatorial GuineaEritreaEstoniaEthiopiaEuro areaEurope & Central AsiaEurope & Central Asia (excluding high income)Europe & Central Asia (IDA & IBRD countries)European UnionFijiFinlandFragile and conflict affected situationsFranceGabonGambia, TheGeorgiaGermanyGhanaGreeceGreenlandGrenadaGuatemalaGuineaGuinea-BissauGuyanaHaitiHeavily indebted poor countries (HIPC)High incomeHondurasHong Kong SAR, ChinaHungaryIBRD onlyIcelandIDA & IBRD totalIDA blendIDA onlyIDA totalIndiaIndonesiaIran, Islamic Rep.IraqIrelandIsraelItalyJamaicaJapanJordanKazakhstanKenyaKiribatiKorea, Rep.KosovoKuwaitKyrgyz RepublicLao PDRLate-demographic dividendLatin America & Caribbean Latin America & Caribbean (excluding high income)Latin America & the Caribbean (IDA & IBRD countries)LatviaLeast developed countries: UN classificationLebanonLesothoLiberiaLibyaLiechtensteinLithuaniaLow & middle incomeLow incomeLower middle incomeLuxembourgMacao SAR, ChinaMacedonia, FYRMadagascarMalawiMalaysiaMaldivesMaliMaltaMarshall IslandsMauritaniaMauritiusMexicoMicronesia, Fed. Sts.Middle East & North AfricaMiddle East & North Africa (excluding high income)Middle East & North Africa (IDA & IBRD countries)Middle incomeMoldovaMonacoMongoliaMontenegroMoroccoMozambiqueMyanmarNamibiaNepalNetherlandsNew ZealandNicaraguaNigerNigeriaNorth AmericaNorwayOECD membersOmanOther small statesPacific island small statesPakistanPalauPanamaPapua New GuineaParaguayPeruPhilippinesPolandPortugalPost-demographic dividendPre-demographic dividendPuerto RicoQatarRomaniaRussian FederationRwandaSamoaSan MarinoSao Tome and PrincipeSaudi ArabiaSenegalSerbiaSeychellesSierra LeoneSingaporeSlovak RepublicSloveniaSmall statesSolomon IslandsSouth AfricaSouth AsiaSouth Asia (IDA & IBRD)SpainSri LankaSt. Kitts and NevisSt. LuciaSt. Vincent and the GrenadinesSub-Saharan Africa Sub-Saharan Africa (excluding high income)Sub-Saharan Africa (IDA & IBRD countries)SudanSurinameSwazilandSwedenSwitzerlandSyrian Arab RepublicTajikistanTanzaniaThailandTimor-LesteTogoTongaTrinidad and TobagoTunisiaTurkeyTurkmenistanTuvaluUgandaUkraineUnited Arab EmiratesUnited KingdomUnited StatesUpper middle incomeUruguayUzbekistanVanuatuVenezuela, RBVietnamWest Bank and GazaWorldYemen, Rep.ZambiaZimbabwe Zeitlinie:
Diese Zeitleiste vorliegt die Graphik ab 1971 J. bis 2015 J. Netherlands. Die Angaben bis 1970 J. sind nicht vorhanden. Die Zahl aktueller Beobachtungen nach Daten: 45.
Die Quelle (Bezeichnung):
Kennzahlen der Weltentwicklung
Die Quelle (Einrichtung):
World Bank staff estimates using data from the United Nations Statistics Division's National Accounts Statistics.
Kategorien:
Economy & Growth, Environment
Es wurde aktualisiert:
23 Apr 2017 Jahr
Kennzahlen der Wertänderungen vom Jahr zum Jahr
Minimum:
12.114
1 Jan 1974 Jahr
Maximum:
16.896
1 Jan 2010 Jahr
Zum Datum der Beobachtung
Wert
Absolute Veränderung
Die Veränderung bezüglich dem vorherigen Wert
1 Jan 1971 Jahr
12.23
+12.23
0.0%
1 Jan 1972 Jahr
12.645
+0.415
3.39%
1 Jan 1973 Jahr
12.698
+0.053
0.42%
1 Jan 1974 Jahr
12.114
-0.583
-4.59%
1 Jan 1975 Jahr
12.766
+0.652
5.38%
1 Jan 1976 Jahr
13.148
+0.382
2.99%
1 Jan 1977 Jahr
12.846
-0.302
-2.3%
1 Jan 1978 Jahr
12.948
+0.103
0.8%
1 Jan 1979 Jahr
13.211
+0.263
2.03%
1 Jan 1980 Jahr
13.672
+0.461
3.49%
1 Jan 1981 Jahr
14.131
+0.459
3.36%
1 Jan 1982 Jahr
14.818
+0.687
4.86%
1 Jan 1983 Jahr
15.21
+0.392
2.65%
1 Jan 1984 Jahr
15.092
-0.118
-0.77%
1 Jan 1985 Jahr
14.852
-0.24
-1.59%
1 Jan 1986 Jahr
15.162
+0.31
2.08%
1 Jan 1987 Jahr
15.256
+0.094
0.62%
1 Jan 1988 Jahr
15.775
+0.519
3.4%
1 Jan 1989 Jahr
16.099
+0.324
2.05%
1 Jan 1990 Jahr
16.13
+0.031
0.19%
1 Jan 1991 Jahr
16.463
+0.333
2.06%
1 Jan 1992 Jahr
16.442
-0.021
-0.13%
1 Jan 1993 Jahr
16.704
+0.262
1.59%
1 Jan 1994 Jahr
16.727
+0.023
0.14%
1 Jan 1995 Jahr
16.258
-0.469
-2.8%
1 Jan 1996 Jahr
15.883
-0.375
-2.31%
1 Jan 1997 Jahr
15.734
-0.148
-0.93%
1 Jan 1998 Jahr
15.408
-0.326
-2.07%
1 Jan 1999 Jahr
15.465
+0.056
0.37%
1 Jan 2000 Jahr
15.268
-0.197
-1.27%
1 Jan 2001 Jahr
15.329
+0.061
0.4%
1 Jan 2002 Jahr
15.855
+0.526
3.43%
1 Jan 2003 Jahr
16.198
+0.343
2.17%
1 Jan 2004 Jahr
16.234
+0.036
0.22%
1 Jan 2005 Jahr
16.078
-0.156
-0.96%
1 Jan 2006 Jahr
16.206
+0.127
0.79%
1 Jan 2007 Jahr
15.612
-0.593
-3.66%
1 Jan 2008 Jahr
15.49
-0.122
-0.78%
1 Jan 2009 Jahr
16.113
+0.623
4.02%
1 Jan 2010 Jahr
16.896
+0.783
4.86%
1 Jan 2011 Jahr
16.805
-0.092
-0.54%
1 Jan 2012 Jahr
16.354
-0.45
-2.68%
1 Jan 2013 Jahr
16.387
+0.032
0.2%
1 Jan 2014 Jahr
16.433
+0.046
0.28%
1 Jan 2015 Jahr
16.377
-0.056
-0.34%
Bewertung der Länder gemäß mit laufender Statistik nach Jahren


Kommentare: