33
/
AIzaSyB4mHJ5NPEv-XzF7P6NDYXjlkCWaeKw5bc
November 30, 2025
98196
Cambodia
KHM
true
2
1
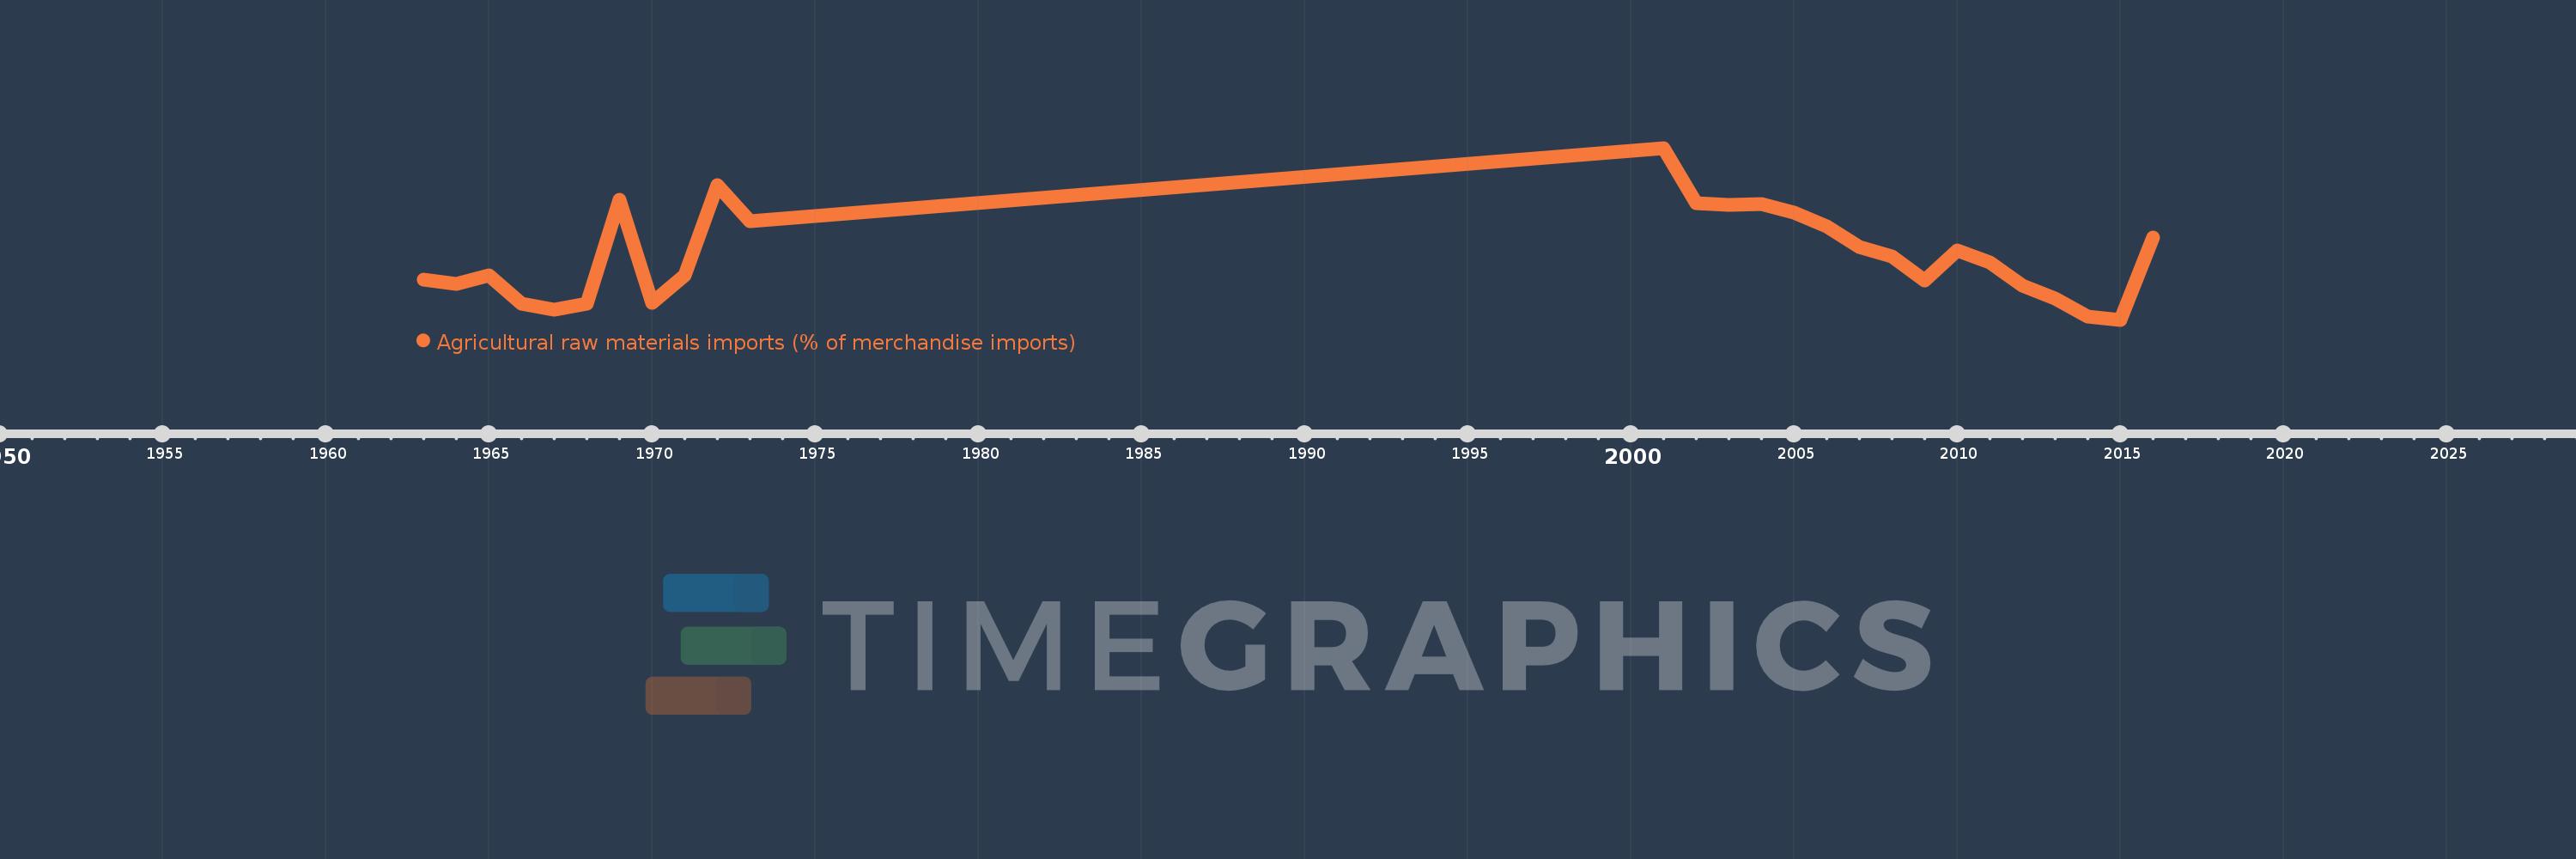
Agricultural raw materials imports (% of merchandise imports)
2016,2015,2014,2013,2012,2011,2010,2009,2008,2007,2006,2005,2004,2003,2002,2001,1973,1972,1971,1970,1969,1968,1967,1966,1965,1964,1963