33
/
AIzaSyB4mHJ5NPEv-XzF7P6NDYXjlkCWaeKw5bc
November 30, 2025
68584
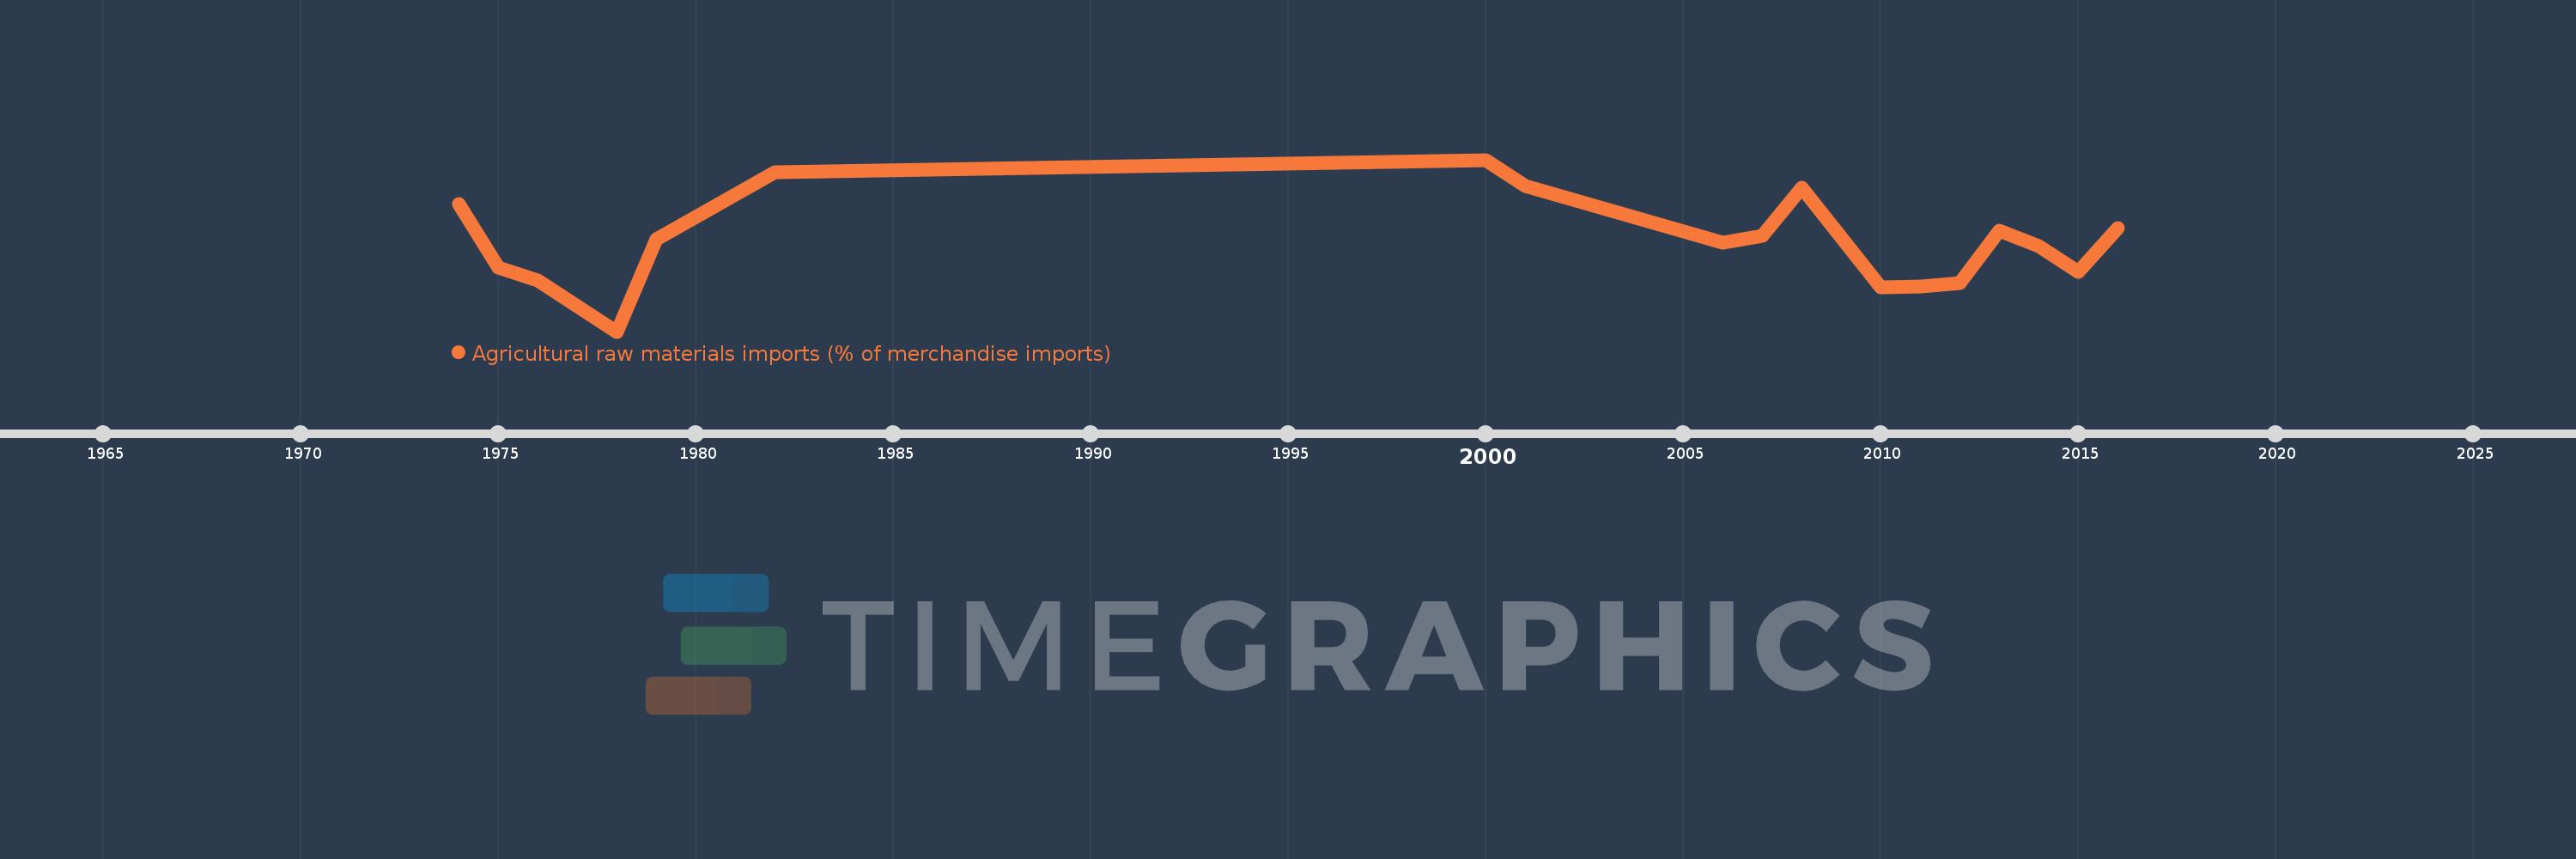
Antigua and Barbuda
ATG
true
2
1
Agricultural raw materials imports (% of merchandise imports)
2016,2015,2014,2013,2012,2011,2010,2008,2007,2006,2001,2000,1982,1979,1978,1976,1975,1974