33
/
AIzaSyB4mHJ5NPEv-XzF7P6NDYXjlkCWaeKw5bc
November 30, 2025
203836
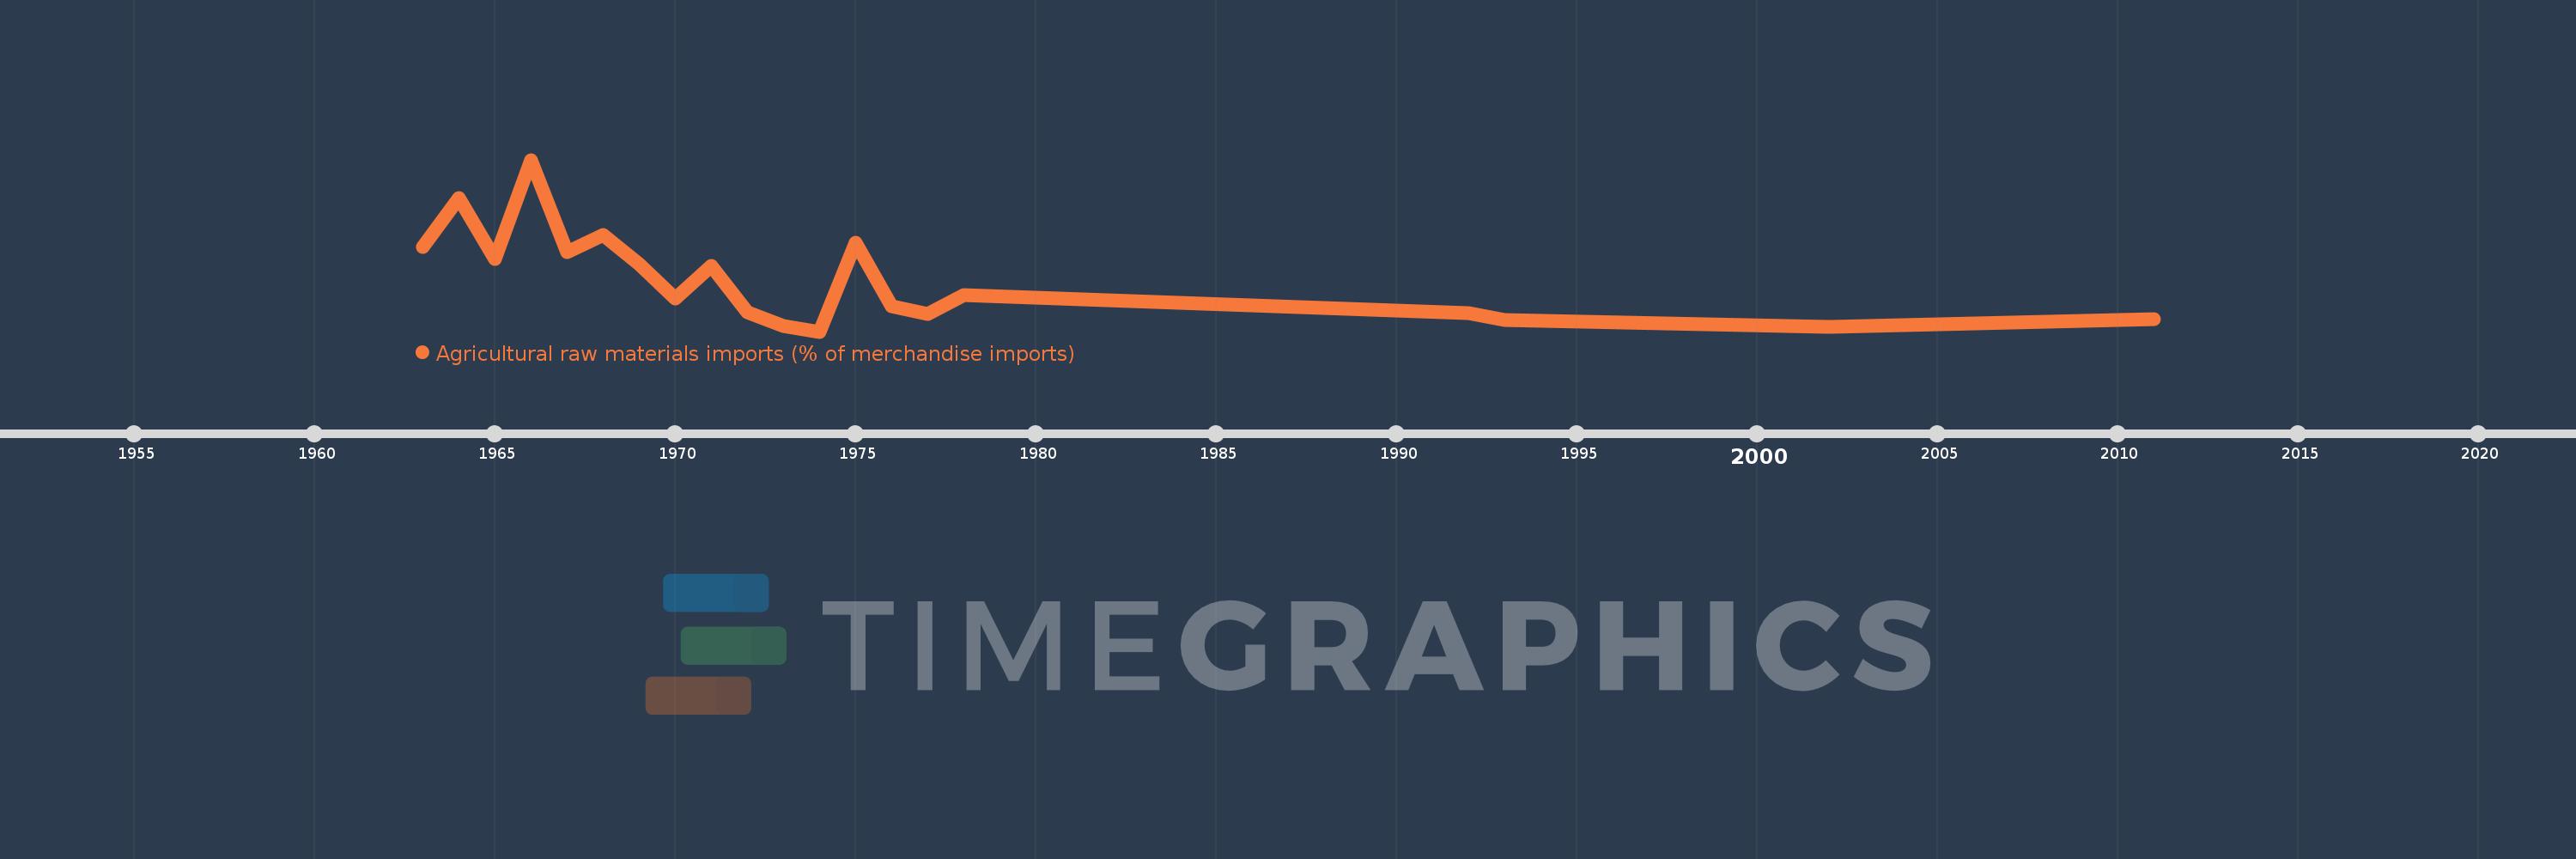
Myanmar
MMR
true
2
1
Agricultural raw materials imports (% of merchandise imports)
2011,2002,1993,1992,1978,1977,1976,1975,1974,1973,1972,1971,1970,1969,1968,1967,1966,1965,1964,1963