33
/
AIzaSyB4mHJ5NPEv-XzF7P6NDYXjlkCWaeKw5bc
November 30, 2025
96850
Burundi
BDI
true
2
1
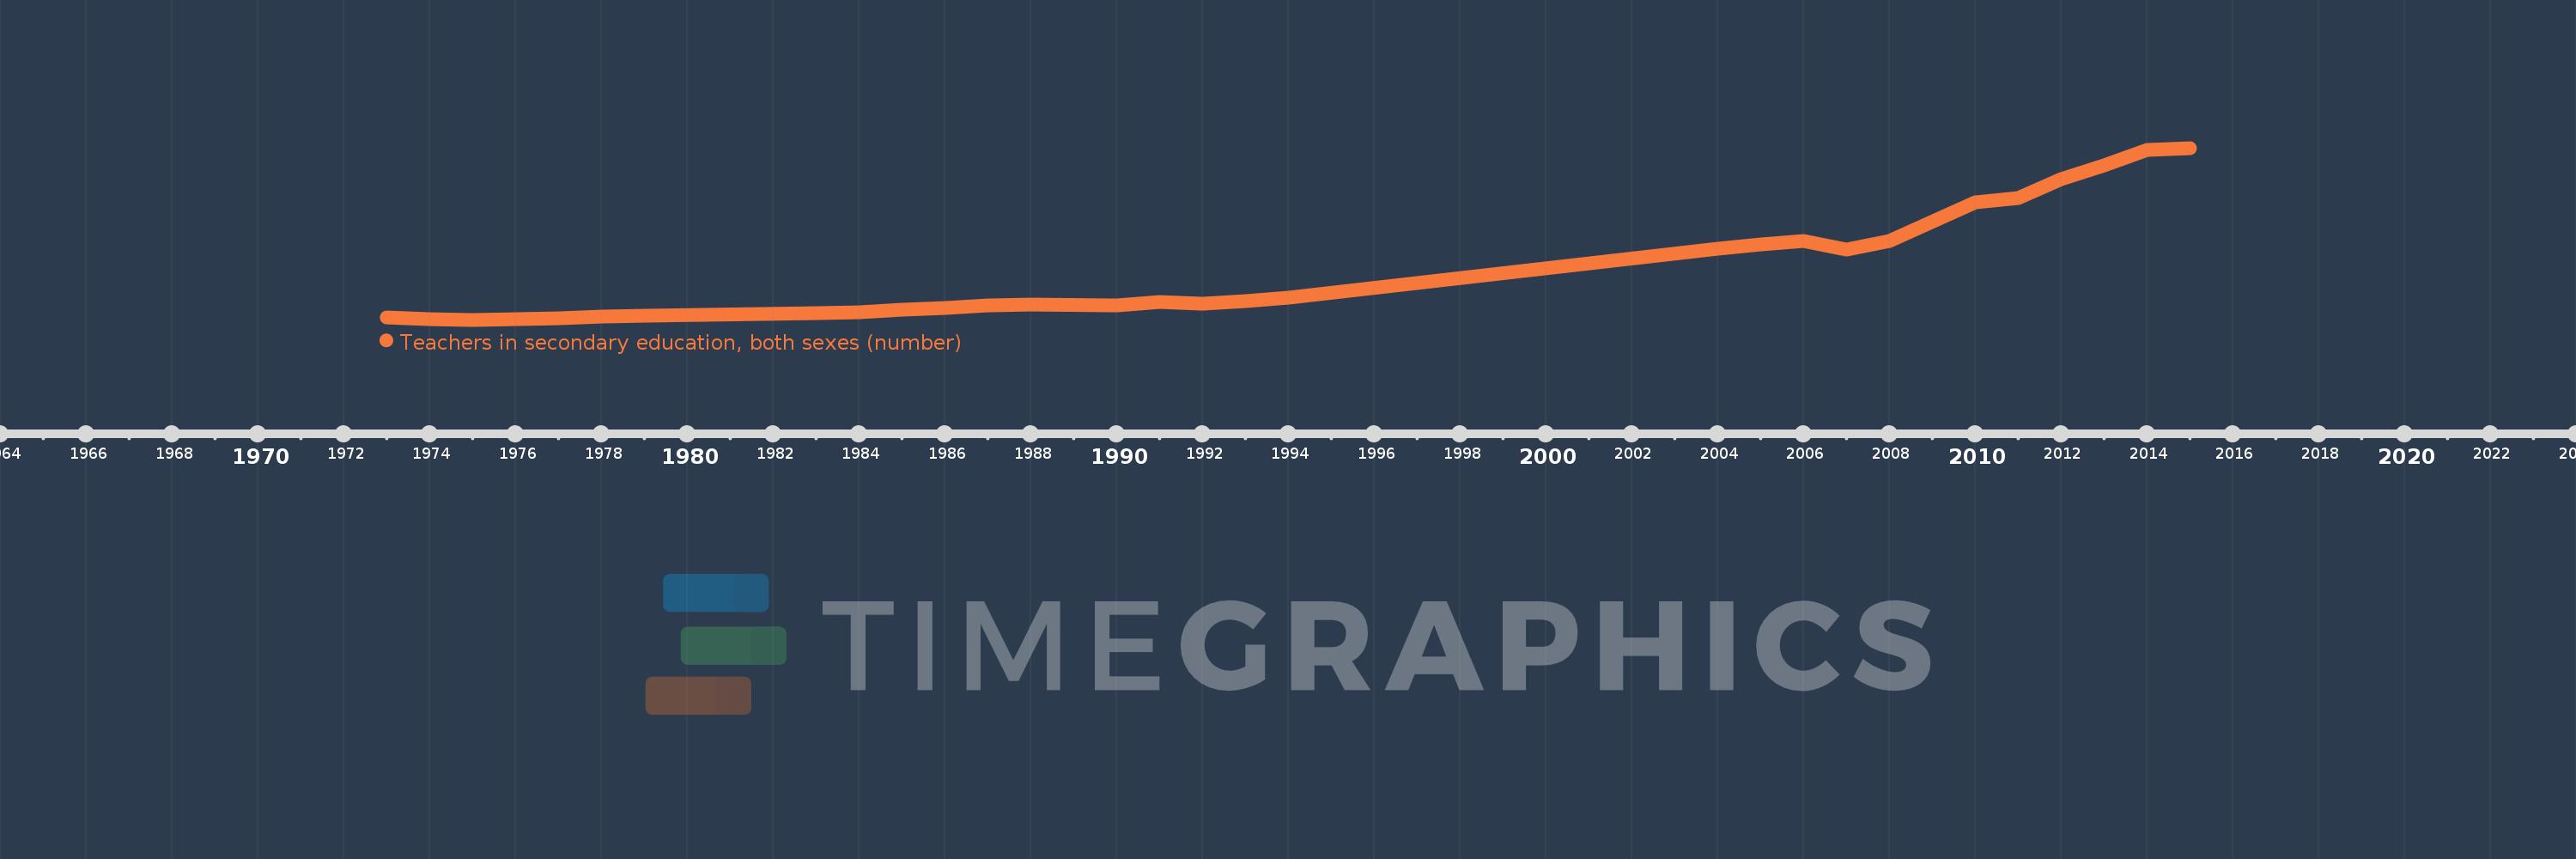
Teachers in secondary education, both sexes (number)
2015,2014,2013,2012,2011,2010,2008,2007,2006,2005,2004,1994,1993,1992,1991,1990,1988,1987,1986,1985,1984,1983,1979,1978,1977,1975,1974,1973