33
/
AIzaSyB4mHJ5NPEv-XzF7P6NDYXjlkCWaeKw5bc
November 30, 2025
279381
Uzbekistan
UZB
true
2
1
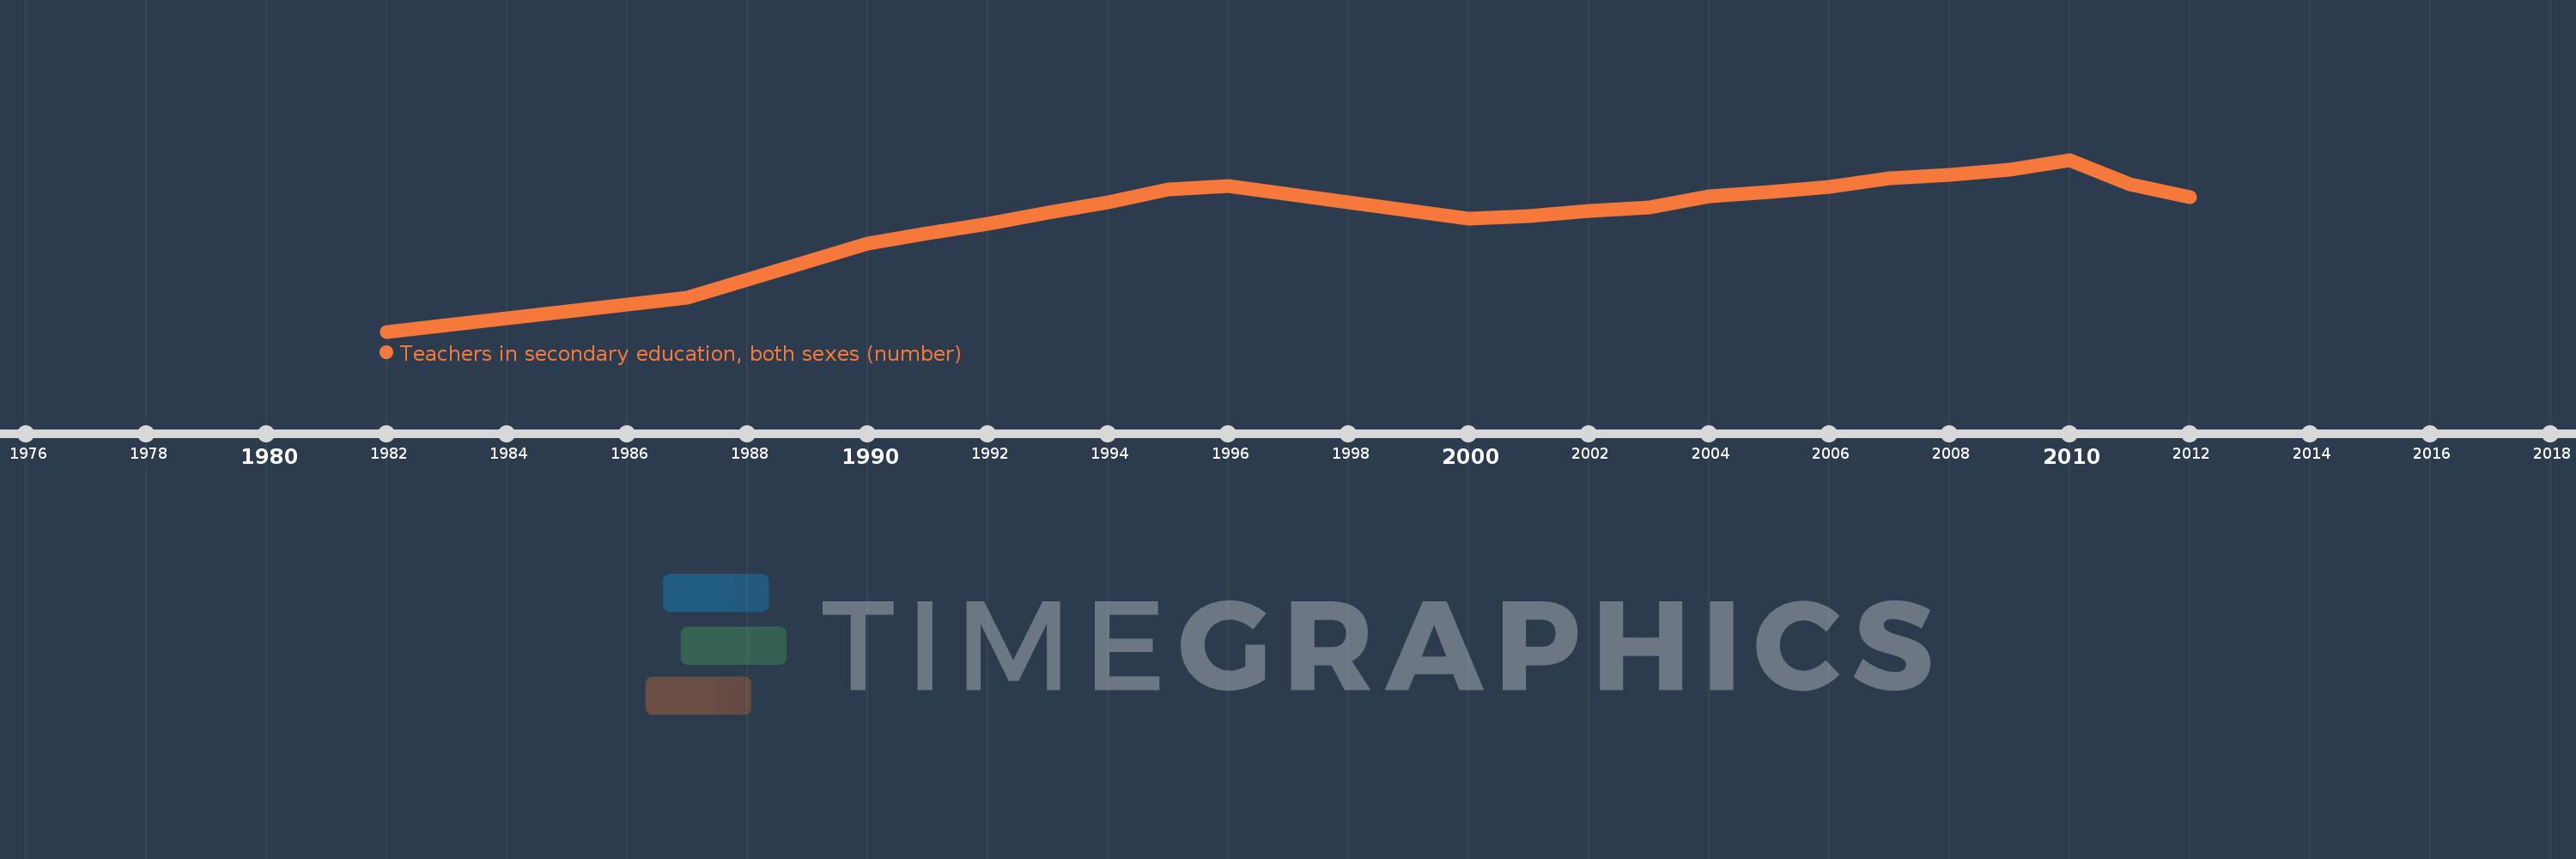
Teachers in secondary education, both sexes (number)
2012,2011,2010,2009,2008,2007,2006,2005,2004,2003,2002,2001,2000,1996,1995,1994,1993,1992,1991,1990,1987,1982