33
/
AIzaSyB4mHJ5NPEv-XzF7P6NDYXjlkCWaeKw5bc
November 30, 2025
70583
Argentina
ARG
true
2
1
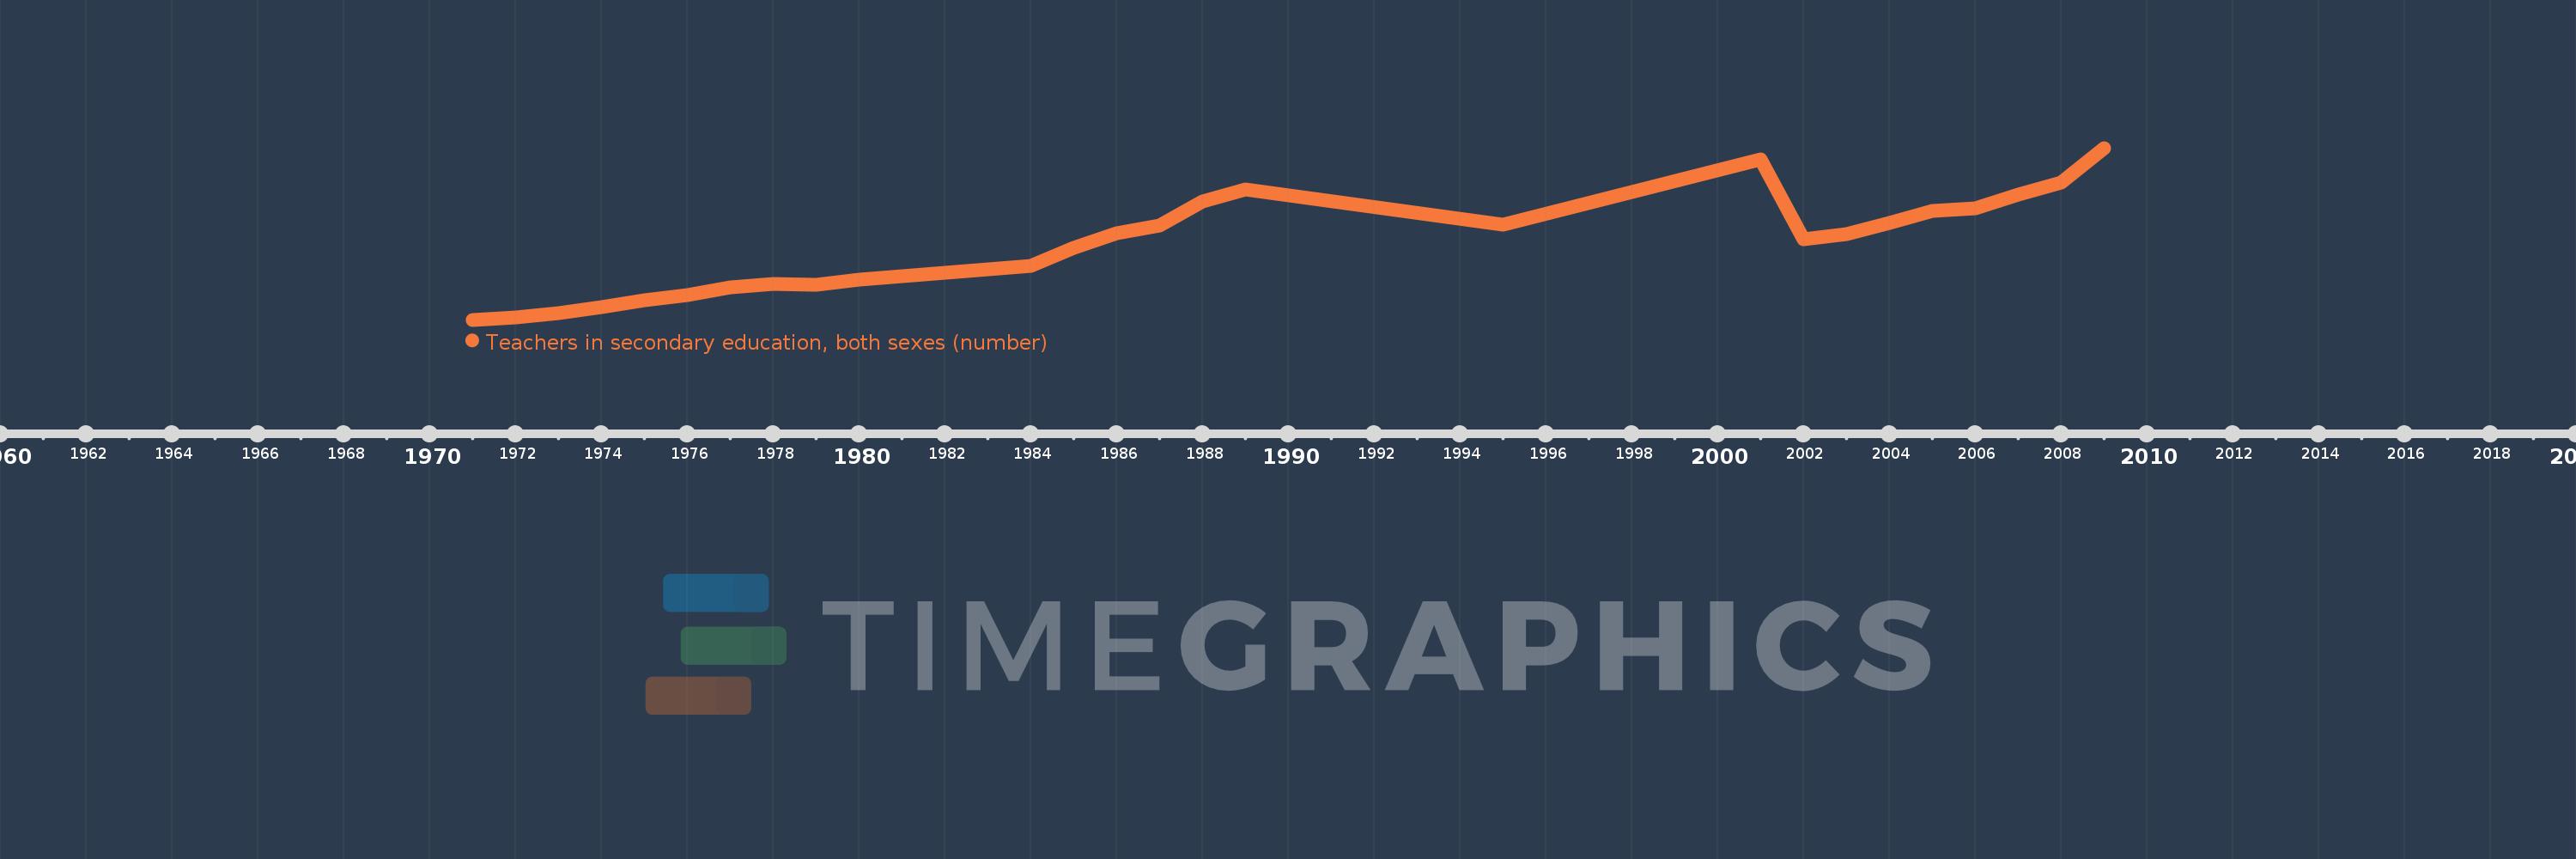
Teachers in secondary education, both sexes (number)
2009,2008,2007,2006,2005,2004,2003,2002,2001,1995,1989,1988,1987,1986,1985,1984,1980,1979,1978,1977,1976,1975,1974,1973,1972,1971