33
/
AIzaSyB4mHJ5NPEv-XzF7P6NDYXjlkCWaeKw5bc
November 30, 2025
94094
Bulgaria
BGR
true
2
1
PPG, IBRD (INT, current US$)
2016,2015,2014,2013,2012,2011,2010,2009,2008,2007,2006,2005,2004,2003,2002,2001,2000,1999,1998,1997,1996,1995,1994,1993
Create a timeline
Public Timelines
For education
For educational institutions
For teachers
For students
Cabinet
For educational institutions
For teachers
For students
Open cabinet
FAQ
Close
Create a timeline
Public timelines
FAQ
About & Feedback
Terms
Privacy
FAQ
Support 24/7
Cabinet
Get premium
Donate
Download
Global statistics library
→
Bulgaria
→
PPG, IBRD (INT, current US$)
This statistics in other country:
Albania
Algeria
Angola
Argentina
Armenia
Azerbaijan
Bangladesh
Belarus
Belize
Bolivia
Bosnia and Herzegovina
Botswana
Brazil
Bulgaria
Burundi
Cabo Verde
Cameroon
Chad
China
Colombia
Congo, Dem. Rep.
Congo, Rep.
Costa Rica
Cote d'Ivoire
Dominica
Dominican Republic
East Asia & Pacific (excluding high income)
Ecuador
Egypt, Arab Rep.
El Salvador
Ethiopia
Europe & Central Asia (excluding high income)
Fiji
Gabon
Georgia
Ghana
Grenada
Guatemala
Guinea
Guyana
Haiti
Honduras
IDA only
India
Indonesia
Iran, Islamic Rep.
Jamaica
Jordan
Kazakhstan
Kenya
Kosovo
Latin America & Caribbean (excluding high income)
Lebanon
Lesotho
Liberia
Low & middle income
Low income
Lower middle income
Macedonia, FYR
Madagascar
Malawi
Malaysia
Mauritania
Mauritius
Mexico
Middle East & North Africa (excluding high income)
Middle income
Moldova
Montenegro
Morocco
Myanmar
Nicaragua
Nigeria
Pakistan
Panama
Papua New Guinea
Paraguay
Peru
Philippines
Romania
Russian Federation
Senegal
Serbia
Sierra Leone
South Africa
South Asia
Sri Lanka
St. Lucia
St. Vincent and the Grenadines
Sub-Saharan Africa (excluding high income)
Sudan
Swaziland
Syrian Arab Republic
Tanzania
Thailand
Togo
Tunisia
Turkey
Turkmenistan
Uganda
Ukraine
Upper middle income
Uzbekistan
Venezuela, RB
Vietnam
Zambia
Zimbabwe
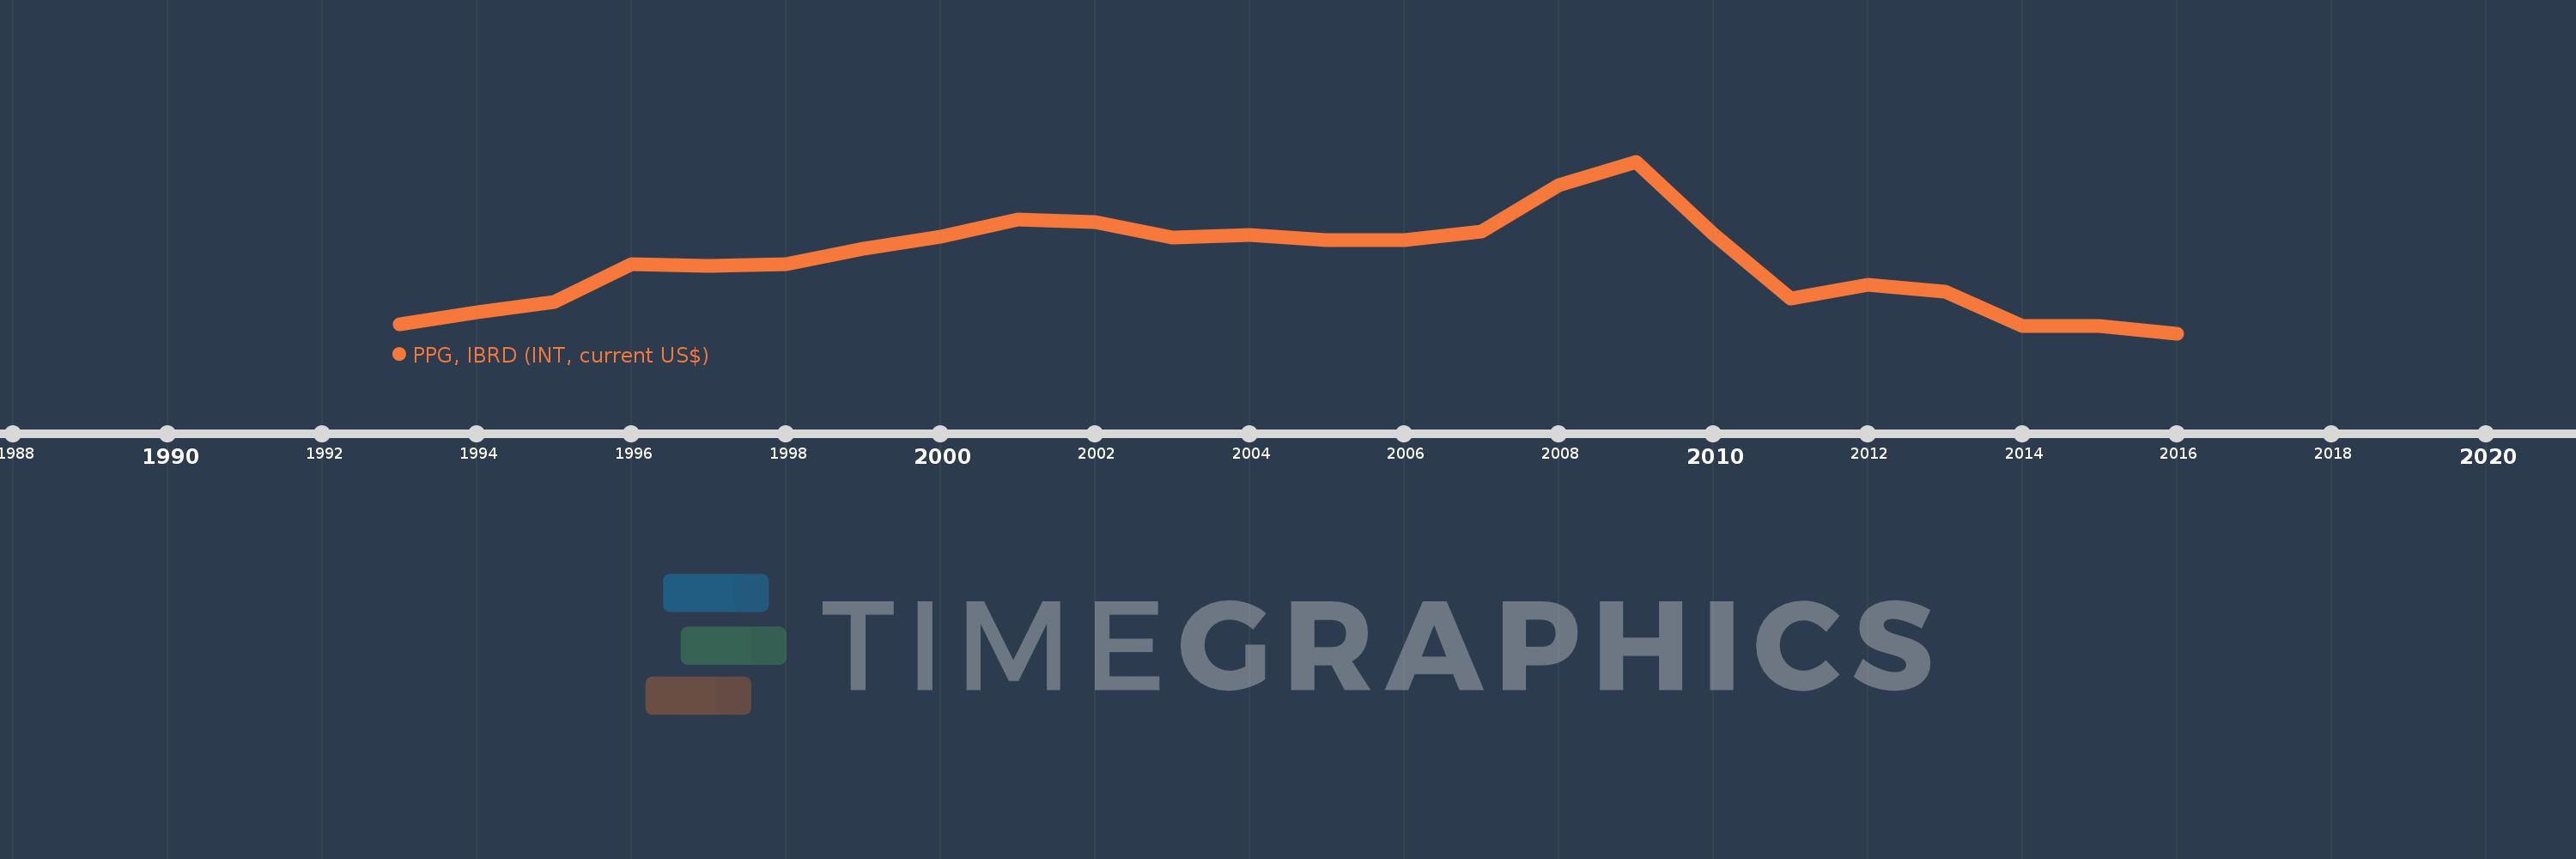
Timeline:
This timeline shows a graph from
1993
to
2016
of Bulgaria. No data until
1992
. Number of actual observations by date:
24
.
Source name:
World Development Indicators
Source organization:
World Bank, International Debt Statistics.
Categories, topics:
External Debt
Last updated:
apr 23, 2017
Indicators value changes by year
Meaning:
31.672 mln
Minimum:
2.995 mln
jan 1, 2016
Maximum:
71.937 mln
jan 1, 2009
At the date of observation
Value
Absolute change
Change from the previous value
jan 1, 1993
6.692 mln
+6.692 mln
0.0%
jan 1, 1994
11.517 mln
+4.825 mln
72.1%
jan 1, 1995
15.429 mln
+3.912 mln
33.97%
jan 1, 1996
30.731 mln
+15.302 mln
99.18%
jan 1, 1997
29.96 mln
-771.0K
-2.51%
jan 1, 1998
30.656 mln
+696.0K
2.32%
jan 1, 1999
36.865 mln
+6.209 mln
20.25%
jan 1, 2000
41.937 mln
+5.072 mln
13.76%
jan 1, 2001
48.73 mln
+6.793 mln
16.2%
jan 1, 2002
47.632 mln
-1.098 mln
-2.25%
jan 1, 2003
41.474 mln
-6.158 mln
-12.93%
jan 1, 2004
42.45 mln
+976.0K
2.35%
jan 1, 2005
40.567 mln
-1.883 mln
-4.44%
jan 1, 2006
40.477 mln
-90.0K
-0.22%
jan 1, 2007
43.955 mln
+3.478 mln
8.59%
jan 1, 2008
62.379 mln
+18.424 mln
41.92%
jan 1, 2009
71.937 mln
+9.558 mln
15.32%
jan 1, 2010
42.897 mln
-29.04 mln
-40.37%
jan 1, 2011
16.916 mln
-25.981 mln
-60.57%
jan 1, 2012
22.563 mln
+5.647 mln
33.38%
jan 1, 2013
19.703 mln
-2.86 mln
-12.68%
jan 1, 2014
5.764 mln
-13.939 mln
-70.75%
jan 1, 2015
5.89 mln
+126.0K
2.19%
jan 1, 2016
2.995 mln
-2.895 mln
-49.15%
Ranking of countries by current statistics by years
About & Feedback
Terms
Privacy
FAQ
Support 24/7
Cabinet
Get premium
Donate
The service accepts bank transfer (ACH, Wire) or cards (Visa, MasterCard, etc). Processed by Stripe.
Secured with SSL