33
/
AIzaSyB4mHJ5NPEv-XzF7P6NDYXjlkCWaeKw5bc
November 30, 2025
166701
Kazakhstan
KAZ
true
2
1
PPG, IBRD (INT, current US$)
2016,2015,2014,2013,2012,2011,2010,2009,2008,2007,2006,2005,2004,2003,2002,2001,2000,1999,1998,1997,1996,1995
Create a timeline
Public Timelines
For education
For educational institutions
For teachers
For students
Cabinet
For educational institutions
For teachers
For students
Open cabinet
FAQ
Close
Create a timeline
Public timelines
FAQ
About & Feedback
Terms
Privacy
FAQ
Support 24/7
Cabinet
Get premium
Donate
Download
Global statistics library
→
Kazakhstan
→
PPG, IBRD (INT, current US$)
This statistics in other country:
Albania
Algeria
Angola
Argentina
Armenia
Azerbaijan
Bangladesh
Belarus
Belize
Bolivia
Bosnia and Herzegovina
Botswana
Brazil
Bulgaria
Burundi
Cabo Verde
Cameroon
Chad
China
Colombia
Congo, Dem. Rep.
Congo, Rep.
Costa Rica
Cote d'Ivoire
Dominica
Dominican Republic
East Asia & Pacific (excluding high income)
Ecuador
Egypt, Arab Rep.
El Salvador
Ethiopia
Europe & Central Asia (excluding high income)
Fiji
Gabon
Georgia
Ghana
Grenada
Guatemala
Guinea
Guyana
Haiti
Honduras
IDA only
India
Indonesia
Iran, Islamic Rep.
Jamaica
Jordan
Kazakhstan
Kenya
Kosovo
Latin America & Caribbean (excluding high income)
Lebanon
Lesotho
Liberia
Low & middle income
Low income
Lower middle income
Macedonia, FYR
Madagascar
Malawi
Malaysia
Mauritania
Mauritius
Mexico
Middle East & North Africa (excluding high income)
Middle income
Moldova
Montenegro
Morocco
Myanmar
Nicaragua
Nigeria
Pakistan
Panama
Papua New Guinea
Paraguay
Peru
Philippines
Romania
Russian Federation
Senegal
Serbia
Sierra Leone
South Africa
South Asia
Sri Lanka
St. Lucia
St. Vincent and the Grenadines
Sub-Saharan Africa (excluding high income)
Sudan
Swaziland
Syrian Arab Republic
Tanzania
Thailand
Togo
Tunisia
Turkey
Turkmenistan
Uganda
Ukraine
Upper middle income
Uzbekistan
Venezuela, RB
Vietnam
Zambia
Zimbabwe
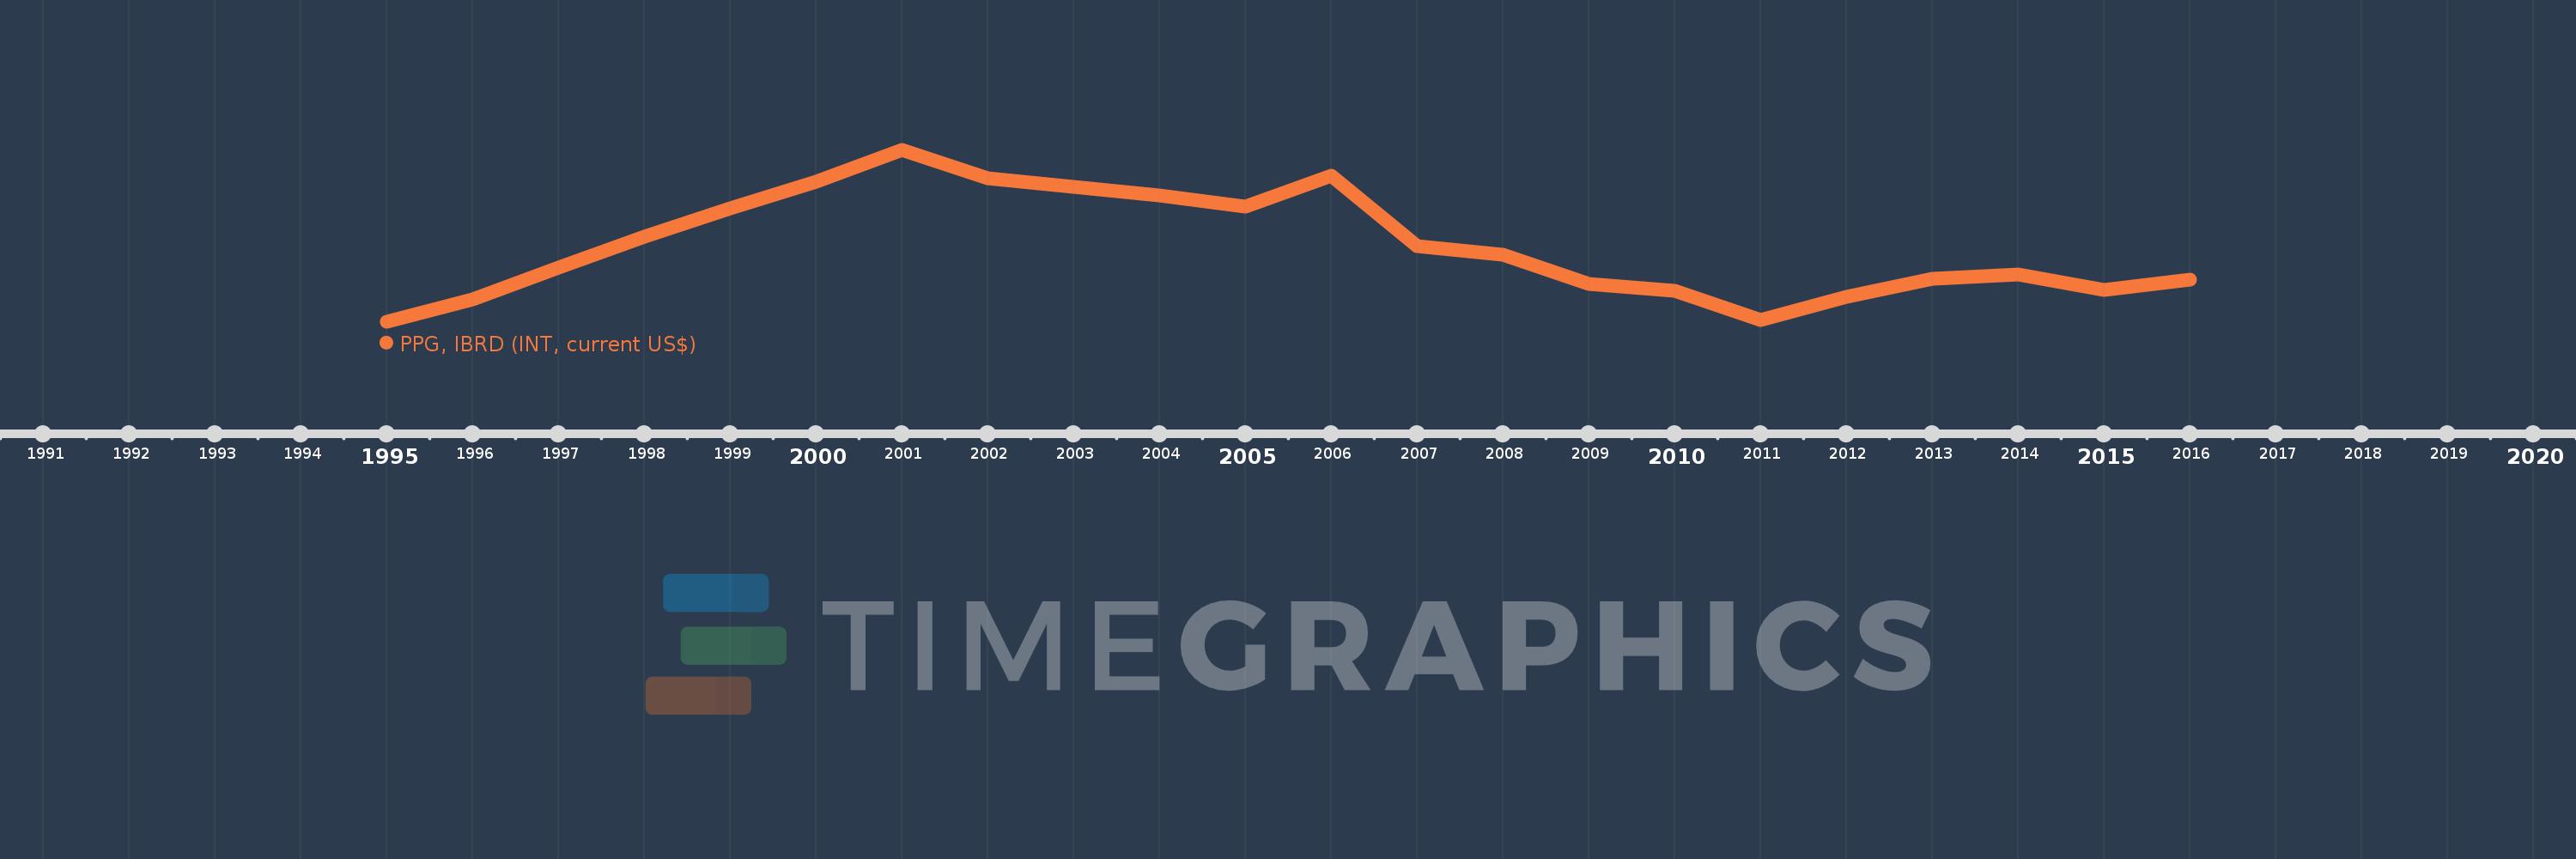
Timeline:
This timeline shows a graph from
1995
to
2016
of Kazakhstan. No data until
1994
. Number of actual observations by date:
22
.
Source name:
World Development Indicators
Source organization:
World Bank, International Debt Statistics.
Categories, topics:
External Debt
Last updated:
apr 23, 2017
Indicators value changes by year
Meaning:
31.211 mln
Minimum:
6.742 mln
jan 1, 1995
Maximum:
62.482 mln
jan 1, 2001
At the date of observation
Value
Absolute change
Change from the previous value
jan 1, 1995
6.742 mln
+6.742 mln
0.0%
jan 1, 1996
14.19 mln
+7.448 mln
110.47%
jan 1, 1997
24.264 mln
+10.074 mln
70.99%
jan 1, 1998
34.398 mln
+10.134 mln
41.77%
jan 1, 1999
43.671 mln
+9.273 mln
26.96%
jan 1, 2000
52.336 mln
+8.665 mln
19.84%
jan 1, 2001
62.482 mln
+10.146 mln
19.39%
jan 1, 2002
53.357 mln
-9.125 mln
-14.6%
jan 1, 2003
50.568 mln
-2.789 mln
-5.23%
jan 1, 2004
47.776 mln
-2.792 mln
-5.52%
jan 1, 2005
44.291 mln
-3.485 mln
-7.29%
jan 1, 2006
54.247 mln
+9.956 mln
22.48%
jan 1, 2007
31.318 mln
-22.929 mln
-42.27%
jan 1, 2008
28.576 mln
-2.742 mln
-8.76%
jan 1, 2009
19.115 mln
-9.461 mln
-33.11%
jan 1, 2010
16.9 mln
-2.215 mln
-11.59%
jan 1, 2011
7.277 mln
-9.623 mln
-56.94%
jan 1, 2012
14.795 mln
+7.518 mln
103.31%
jan 1, 2013
20.639 mln
+5.844 mln
39.5%
jan 1, 2014
22.172 mln
+1.533 mln
7.43%
jan 1, 2015
17.043 mln
-5.129 mln
-23.13%
jan 1, 2016
20.488 mln
+3.445 mln
20.21%
Ranking of countries by current statistics by years
About & Feedback
Terms
Privacy
FAQ
Support 24/7
Cabinet
Get premium
Donate
The service accepts bank transfer (ACH, Wire) or cards (Visa, MasterCard, etc). Processed by Stripe.
Secured with SSL