33
/
AIzaSyB4mHJ5NPEv-XzF7P6NDYXjlkCWaeKw5bc
November 30, 2025
230290
Russian Federation
RUS
true
2
1
PPG, IBRD (INT, current US$)
2016,2015,2014,2013,2012,2011,2010,2009,2008,2007,2006,2005,2004,2003,2002,2001,2000,1999,1998,1997,1996,1995,1994
Create a timeline
Public Timelines
For education
For educational institutions
For teachers
For students
Cabinet
For educational institutions
For teachers
For students
Open cabinet
FAQ
Close
Create a timeline
Public timelines
FAQ
About & Feedback
Terms
Privacy
FAQ
Support 24/7
Cabinet
Get premium
Donate
Download
Global statistics library
→
Russian Federation
→
PPG, IBRD (INT, current US$)
This statistics in other country:
Albania
Algeria
Angola
Argentina
Armenia
Azerbaijan
Bangladesh
Belarus
Belize
Bolivia
Bosnia and Herzegovina
Botswana
Brazil
Bulgaria
Burundi
Cabo Verde
Cameroon
Chad
China
Colombia
Congo, Dem. Rep.
Congo, Rep.
Costa Rica
Cote d'Ivoire
Dominica
Dominican Republic
East Asia & Pacific (excluding high income)
Ecuador
Egypt, Arab Rep.
El Salvador
Ethiopia
Europe & Central Asia (excluding high income)
Fiji
Gabon
Georgia
Ghana
Grenada
Guatemala
Guinea
Guyana
Haiti
Honduras
IDA only
India
Indonesia
Iran, Islamic Rep.
Jamaica
Jordan
Kazakhstan
Kenya
Kosovo
Latin America & Caribbean (excluding high income)
Lebanon
Lesotho
Liberia
Low & middle income
Low income
Lower middle income
Macedonia, FYR
Madagascar
Malawi
Malaysia
Mauritania
Mauritius
Mexico
Middle East & North Africa (excluding high income)
Middle income
Moldova
Montenegro
Morocco
Myanmar
Nicaragua
Nigeria
Pakistan
Panama
Papua New Guinea
Paraguay
Peru
Philippines
Romania
Russian Federation
Senegal
Serbia
Sierra Leone
South Africa
South Asia
Sri Lanka
St. Lucia
St. Vincent and the Grenadines
Sub-Saharan Africa (excluding high income)
Sudan
Swaziland
Syrian Arab Republic
Tanzania
Thailand
Togo
Tunisia
Turkey
Turkmenistan
Uganda
Ukraine
Upper middle income
Uzbekistan
Venezuela, RB
Vietnam
Zambia
Zimbabwe
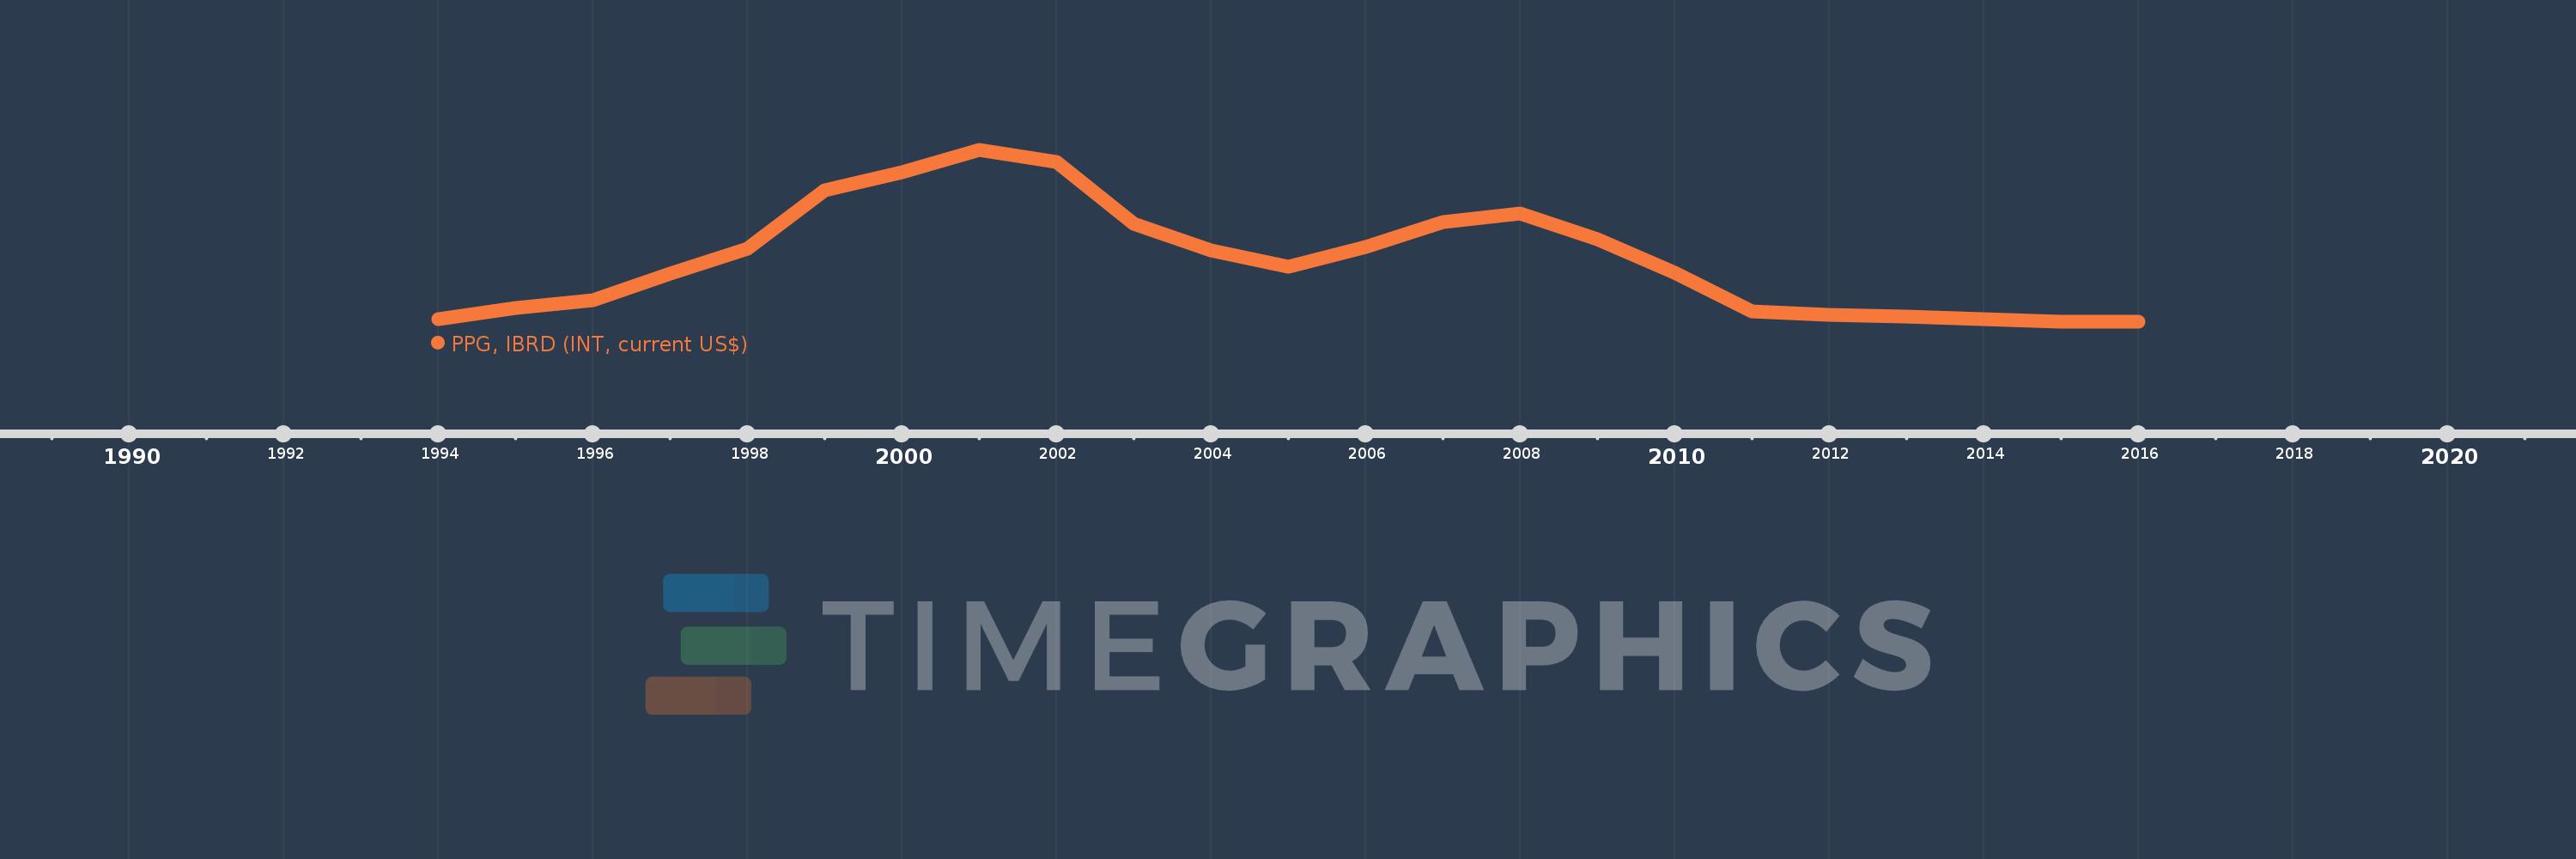
Timeline:
This timeline shows a graph from
1994
to
2016
of Russian Federation. No data until
1993
. Number of actual observations by date:
23
.
Source name:
World Development Indicators
Source organization:
World Bank, International Debt Statistics.
Categories, topics:
External Debt
Last updated:
apr 23, 2017
Indicators value changes by year
Meaning:
153.542 mln
Minimum:
5.383 mln
jan 1, 2016
Maximum:
412.074 mln
jan 1, 2001
At the date of observation
Value
Absolute change
Change from the previous value
jan 1, 1994
11.622 mln
+11.622 mln
0.0%
jan 1, 1995
37.587 mln
+25.965 mln
223.41%
jan 1, 1996
56.841 mln
+19.254 mln
51.23%
jan 1, 1997
120.758 mln
+63.917 mln
112.45%
jan 1, 1998
178.144 mln
+57.386 mln
47.52%
jan 1, 1999
316.449 mln
+138.305 mln
77.64%
jan 1, 2000
359.133 mln
+42.684 mln
13.49%
jan 1, 2001
412.074 mln
+52.941 mln
14.74%
jan 1, 2002
384.399 mln
-27.675 mln
-6.72%
jan 1, 2003
238.162 mln
-146.237 mln
-38.04%
jan 1, 2004
174.618 mln
-63.544 mln
-26.68%
jan 1, 2005
136.671 mln
-37.947 mln
-21.73%
jan 1, 2006
183.769 mln
+47.098 mln
34.46%
jan 1, 2007
242.5 mln
+58.731 mln
31.96%
jan 1, 2008
261.821 mln
+19.321 mln
7.97%
jan 1, 2009
201.561 mln
-60.26 mln
-23.02%
jan 1, 2010
121.273 mln
-80.288 mln
-39.83%
jan 1, 2011
29.684 mln
-91.589 mln
-75.52%
jan 1, 2012
21.66 mln
-8.024 mln
-27.03%
jan 1, 2013
18.516 mln
-3.144 mln
-14.52%
jan 1, 2014
11.917 mln
-6.599 mln
-35.64%
jan 1, 2015
6.925 mln
-4.992 mln
-41.89%
jan 1, 2016
5.383 mln
-1.542 mln
-22.27%
Ranking of countries by current statistics by years
About & Feedback
Terms
Privacy
FAQ
Support 24/7
Cabinet
Get premium
Donate
The service accepts bank transfer (ACH, Wire) or cards (Visa, MasterCard, etc). Processed by Stripe.
Secured with SSL