Download This statistics in other country:
Timeline:
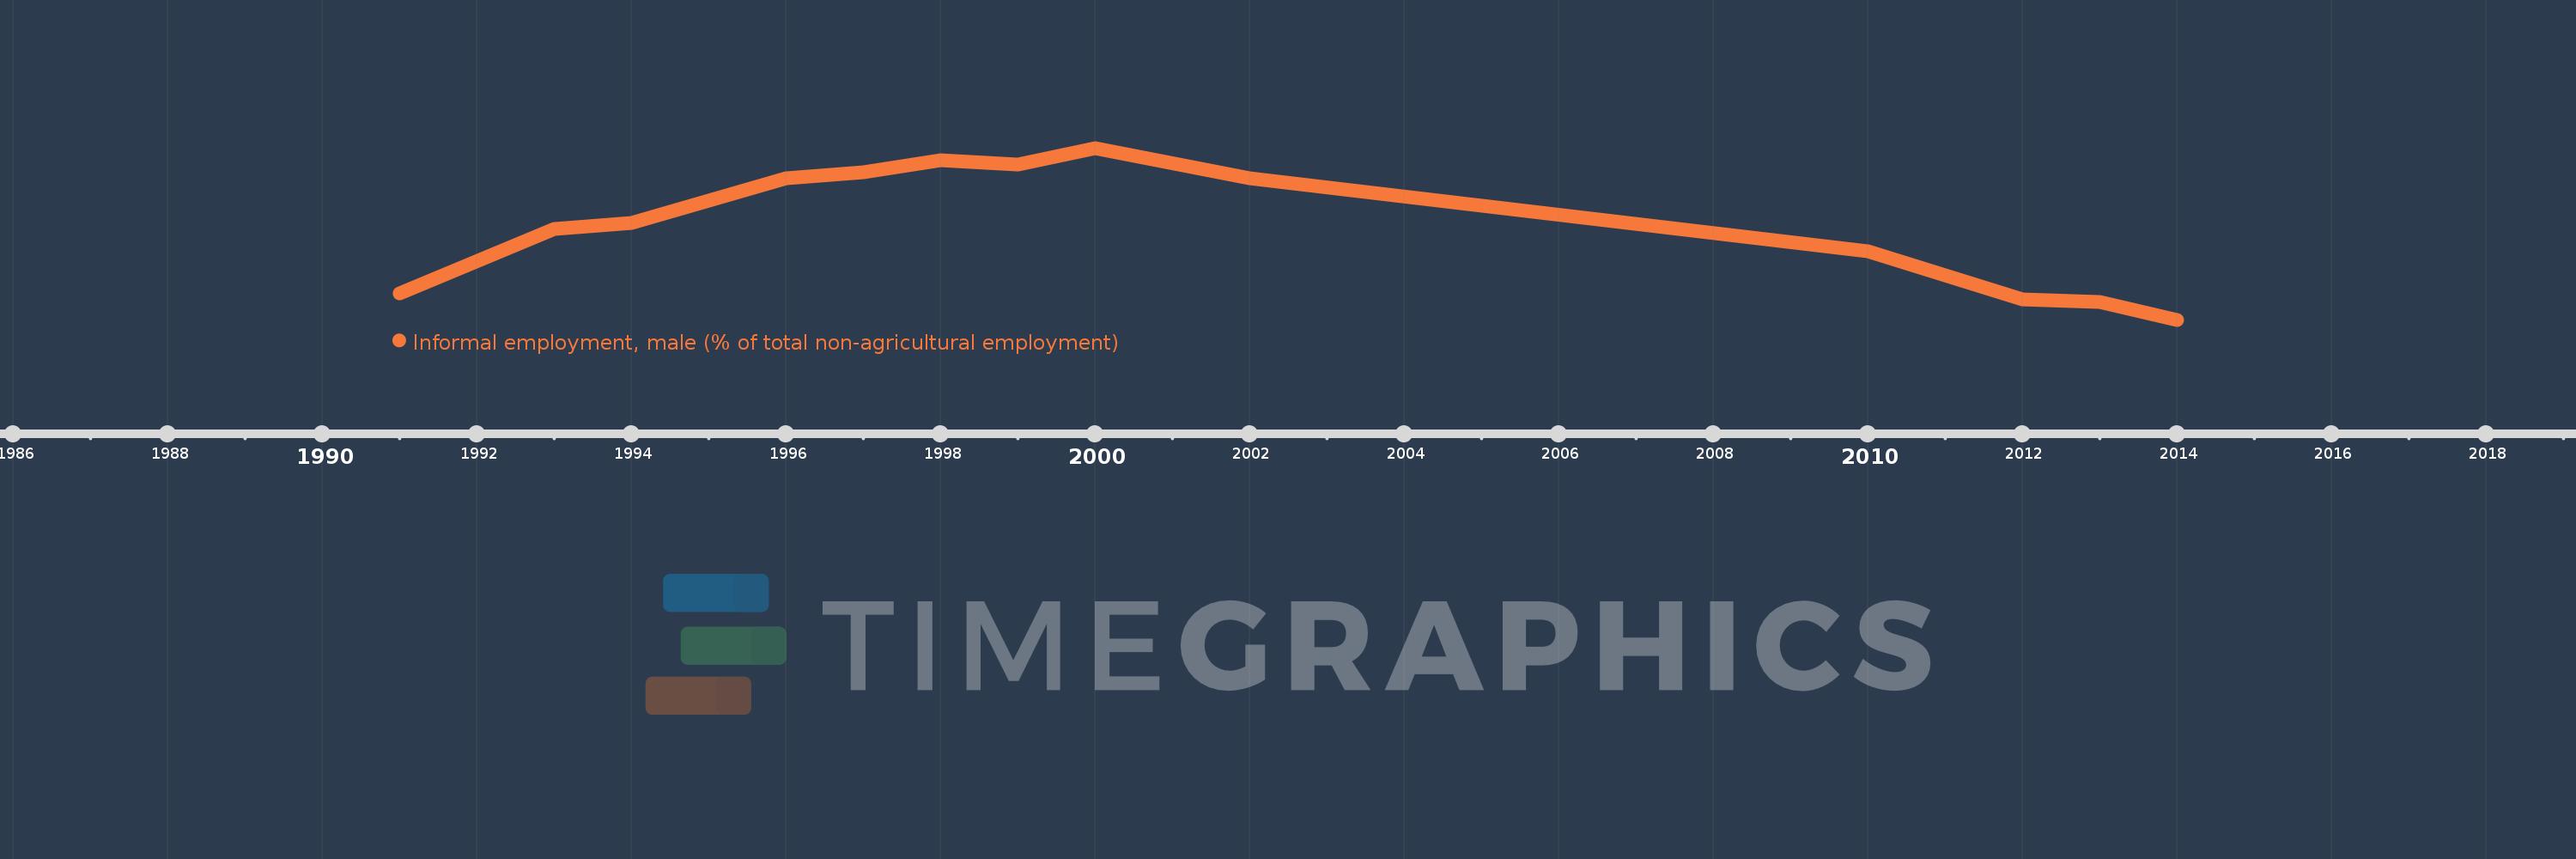
This timeline shows a graph from 1991 to 2014 of Brazil. No data until 1990. Number of actual observations by date: 13.
Source name:
World Development Indicators
Source organization:
International Labour Organization, Key Indicators of the Labour Market database.
Categories, topics:
Social Protection & Labor
Last updated:
apr 23, 2017
Indicators value changes by year
At the date of observation
Value
Absolute change
Change from the previous value
jan 1, 1991
37.1
+37.1
0.0%
jan 1, 1993
40.3
+3.2
8.63%
jan 1, 1994
40.6
+0.3
0.74%
jan 1, 1996
42.8
+2.2
5.42%
jan 1, 1997
43.1
+0.3
0.7%
jan 1, 1998
43.7
+0.6
1.39%
jan 1, 1999
43.5
-0.2
-0.46%
jan 1, 2000
44.3
+0.8
1.84%
jan 1, 2002
42.8
-1.5
-3.39%
jan 1, 2010
39.2
-3.6
-8.41%
jan 1, 2012
36.8
-2.4
-6.12%
jan 1, 2013
36.7
-0.1
-0.27%
jan 1, 2014
35.8
-0.9
-2.45%
Ranking of countries by current statistics by years