Download This statistics in other country:
Timeline:
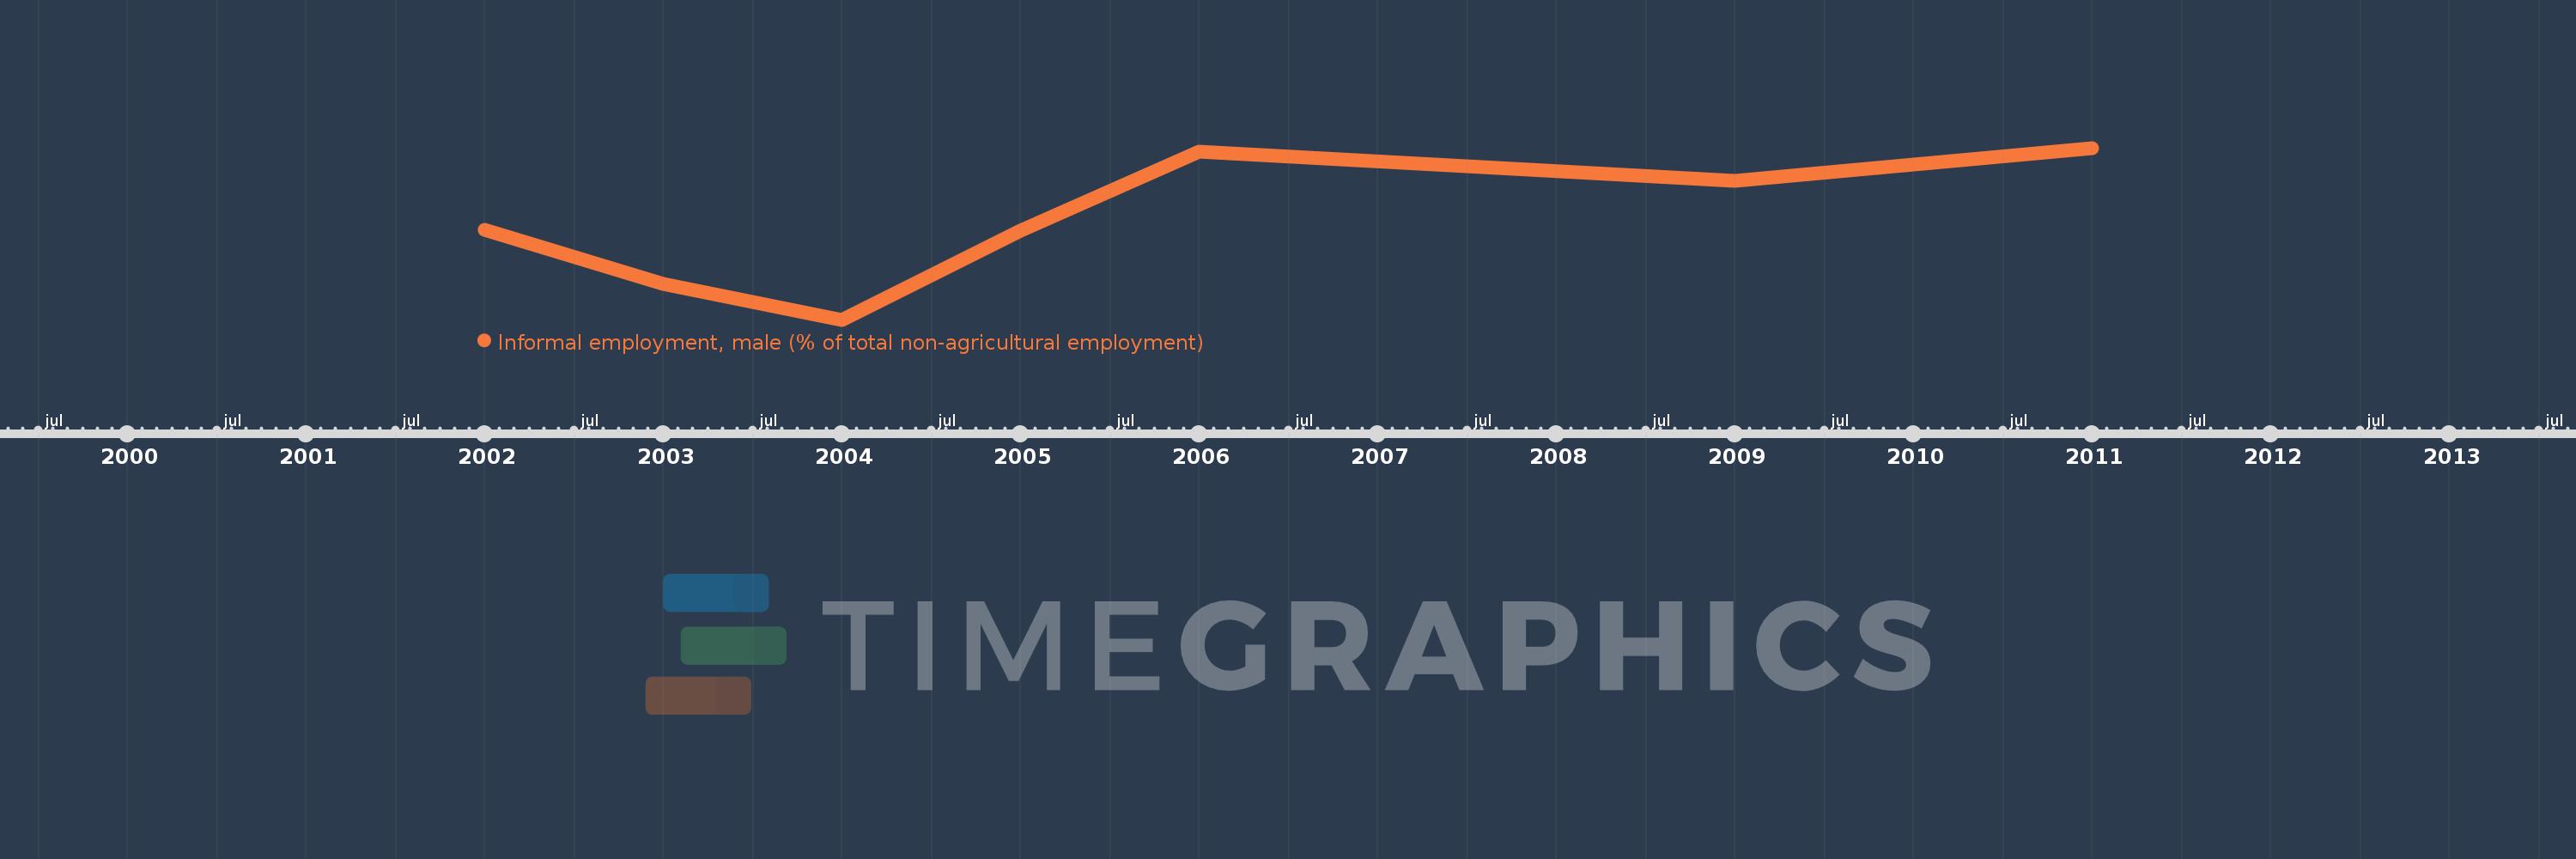
This timeline shows a graph from 2002 to 2011 of Nicaragua. No data until 2001. Number of actual observations by date: 7.
Source name:
World Development Indicators
Source organization:
International Labour Organization, Key Indicators of the Labour Market database.
Categories, topics:
Social Protection & Labor
Last updated:
apr 23, 2017
Indicators value changes by year
At the date of observation
Value
Absolute change
Change from the previous value
jan 1, 2002
54.4
+54.4
0.0%
jan 1, 2003
42.8
-11.6
-21.32%
jan 1, 2004
35.2
-7.6
-17.76%
jan 1, 2005
54.2
+19.0
53.98%
jan 1, 2006
71.2
+17.0
31.37%
jan 1, 2009
64.9
-6.3
-8.85%
jan 1, 2011
72.0
+7.1
10.94%
Ranking of countries by current statistics by years