Download This statistics in other country:
Timeline:
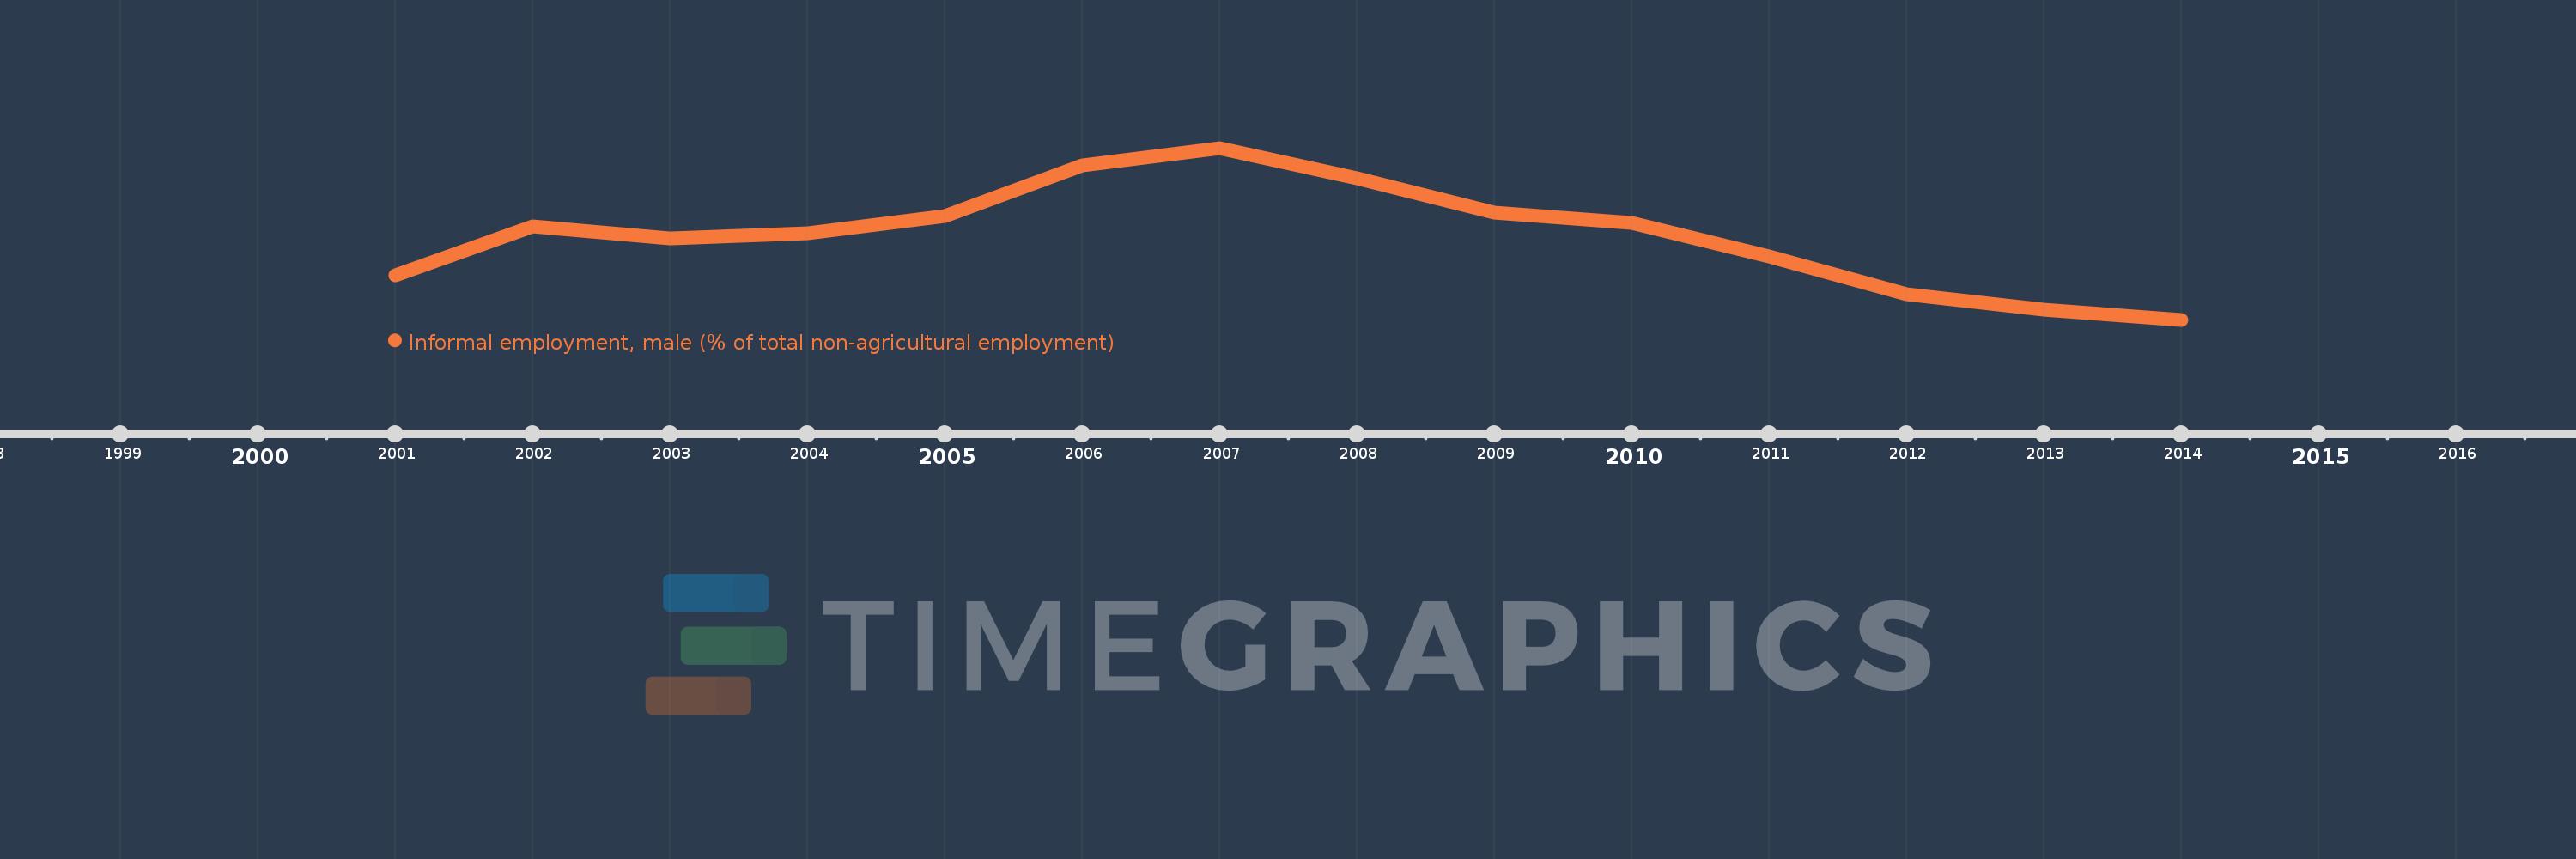
This timeline shows a graph from 2001 to 2014 of Uruguay. No data until 2000. Number of actual observations by date: 14.
Source name:
World Development Indicators
Source organization:
International Labour Organization, Key Indicators of the Labour Market database.
Categories, topics:
Social Protection & Labor
Last updated:
apr 23, 2017
Indicators value changes by year
At the date of observation
Value
Absolute change
Change from the previous value
jan 1, 2001
36.3
+36.3
0.0%
jan 1, 2002
39.2
+2.9
7.99%
jan 1, 2003
38.5
-0.7
-1.79%
jan 1, 2004
38.8
+0.3
0.78%
jan 1, 2005
39.8
+1.0
2.58%
jan 1, 2006
42.8
+3.0
7.54%
jan 1, 2007
43.8
+1.0
2.34%
jan 1, 2008
42.0
-1.8
-4.11%
jan 1, 2009
40.0
-2.0
-4.76%
jan 1, 2010
39.4
-0.6
-1.5%
jan 1, 2011
37.4
-2.0
-5.08%
jan 1, 2012
35.2
-2.2
-5.88%
jan 1, 2013
34.3
-0.9
-2.56%
jan 1, 2014
33.7
-0.6
-1.75%
Ranking of countries by current statistics by years