33
/
AIzaSyB4mHJ5NPEv-XzF7P6NDYXjlkCWaeKw5bc
November 30, 2025
86642
Bhutan
BTN
true
2
1
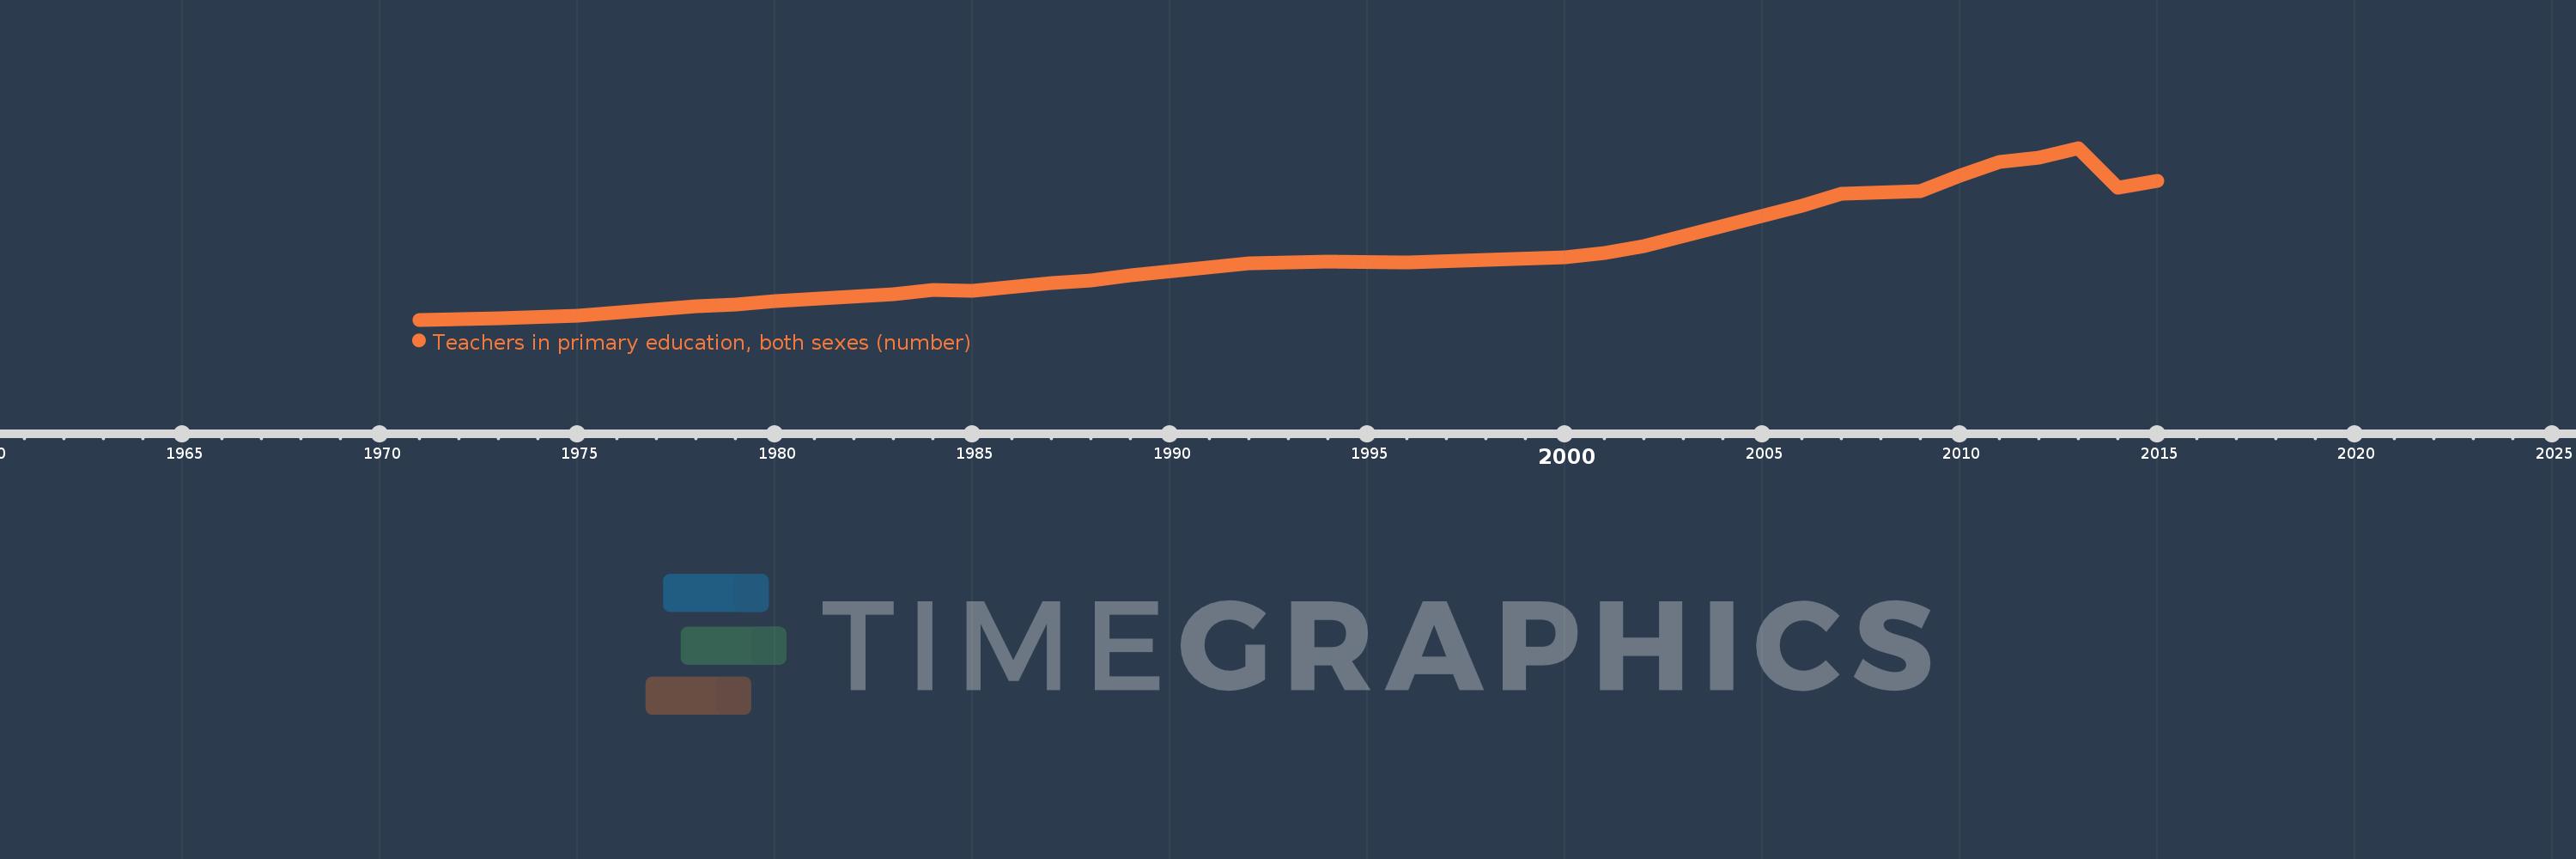
Teachers in primary education, both sexes (number)
2015,2014,2013,2012,2011,2010,2009,2007,2006,2002,2001,2000,1996,1994,1992,1989,1988,1987,1985,1984,1983,1980,1979,1978,1975,1973,1972,1971