33
/
AIzaSyB4mHJ5NPEv-XzF7P6NDYXjlkCWaeKw5bc
November 30, 2025
232855
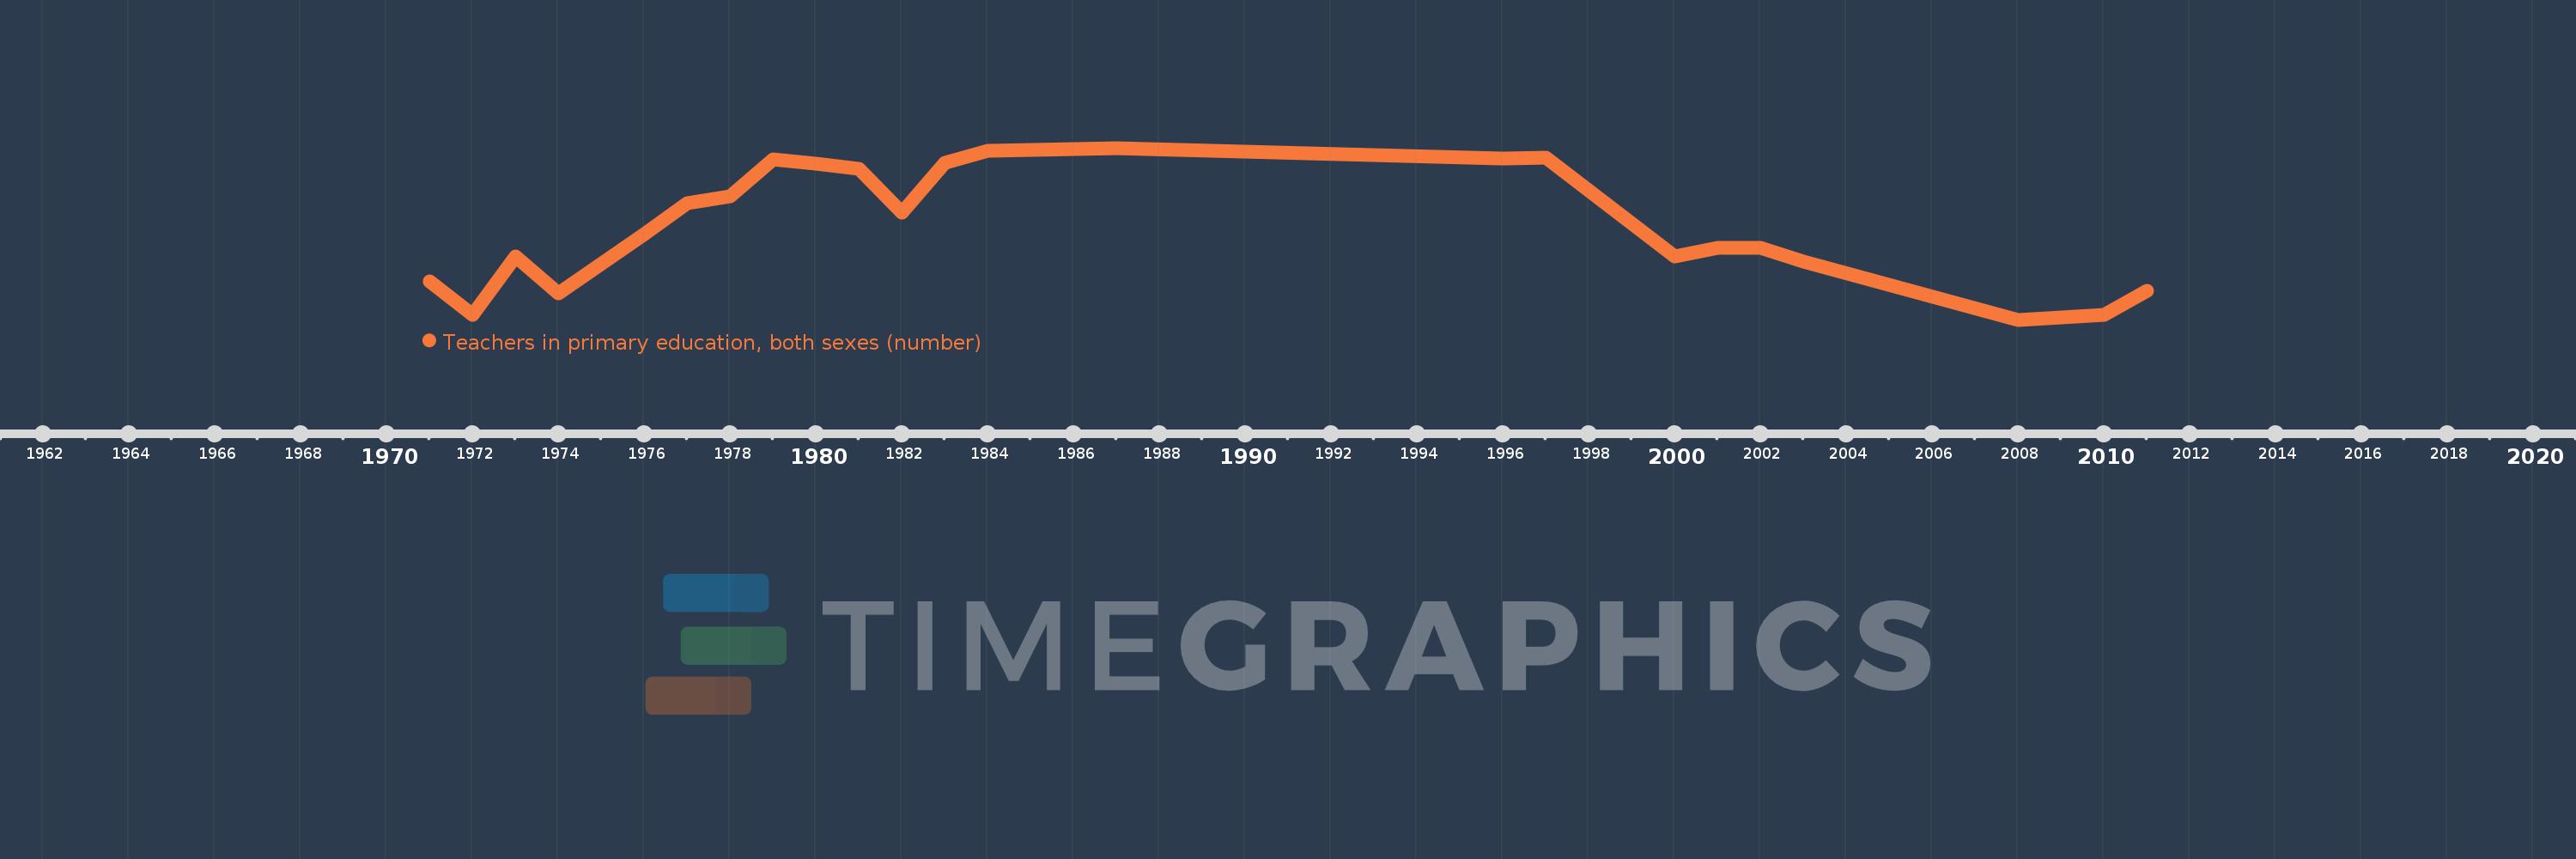
Samoa
WSM
true
2
1
Teachers in primary education, both sexes (number)
2011,2010,2008,2003,2002,2001,2000,1997,1996,1987,1984,1983,1982,1981,1980,1979,1978,1977,1976,1974,1973,1972,1971