33
/
AIzaSyB4mHJ5NPEv-XzF7P6NDYXjlkCWaeKw5bc
November 30, 2025
183372
Macao SAR, China
MAC
true
2
1
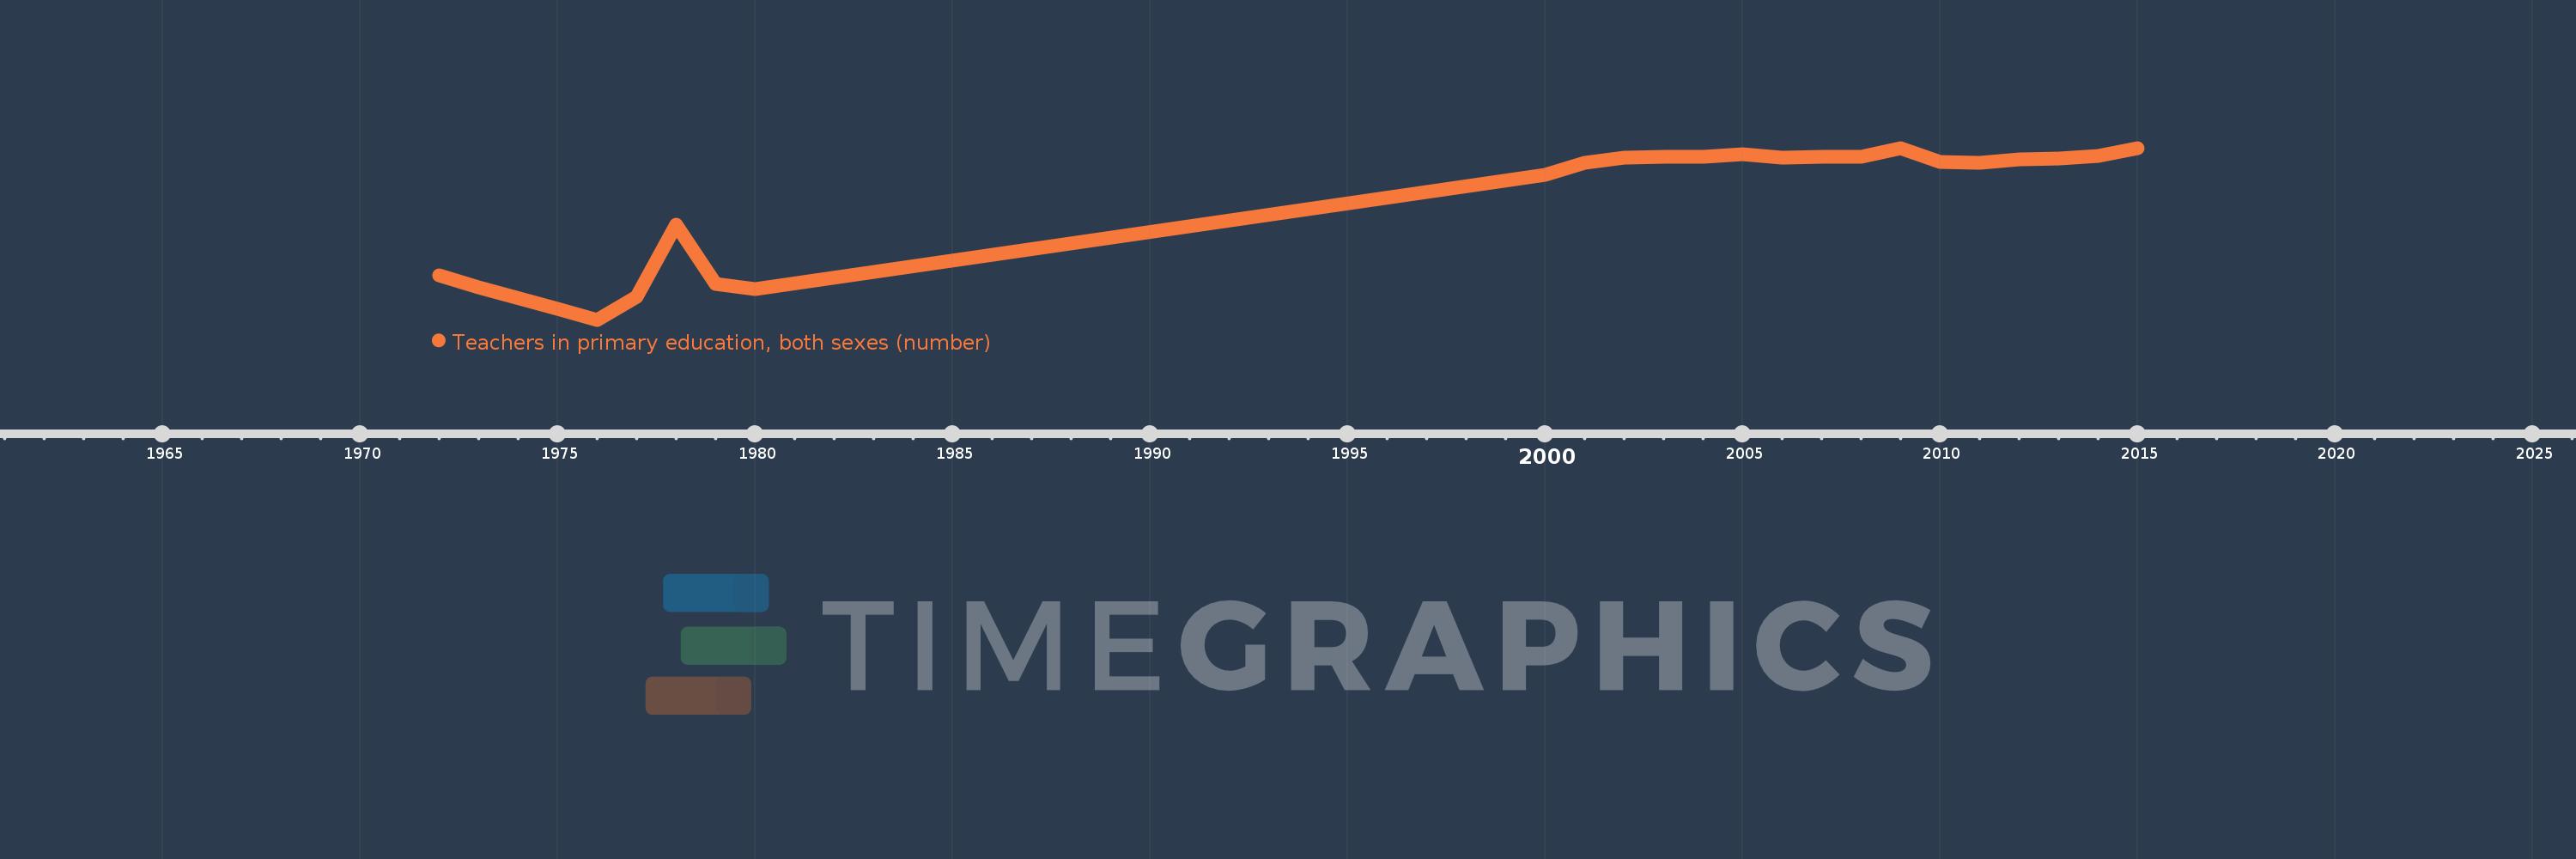
Teachers in primary education, both sexes (number)
2015,2014,2013,2012,2011,2010,2009,2008,2007,2006,2005,2004,2003,2002,2001,2000,1980,1979,1978,1977,1976,1975,1973,1972