33
/
AIzaSyB4mHJ5NPEv-XzF7P6NDYXjlkCWaeKw5bc
November 30, 2025
85859
Bhutan
BTN
true
2
1
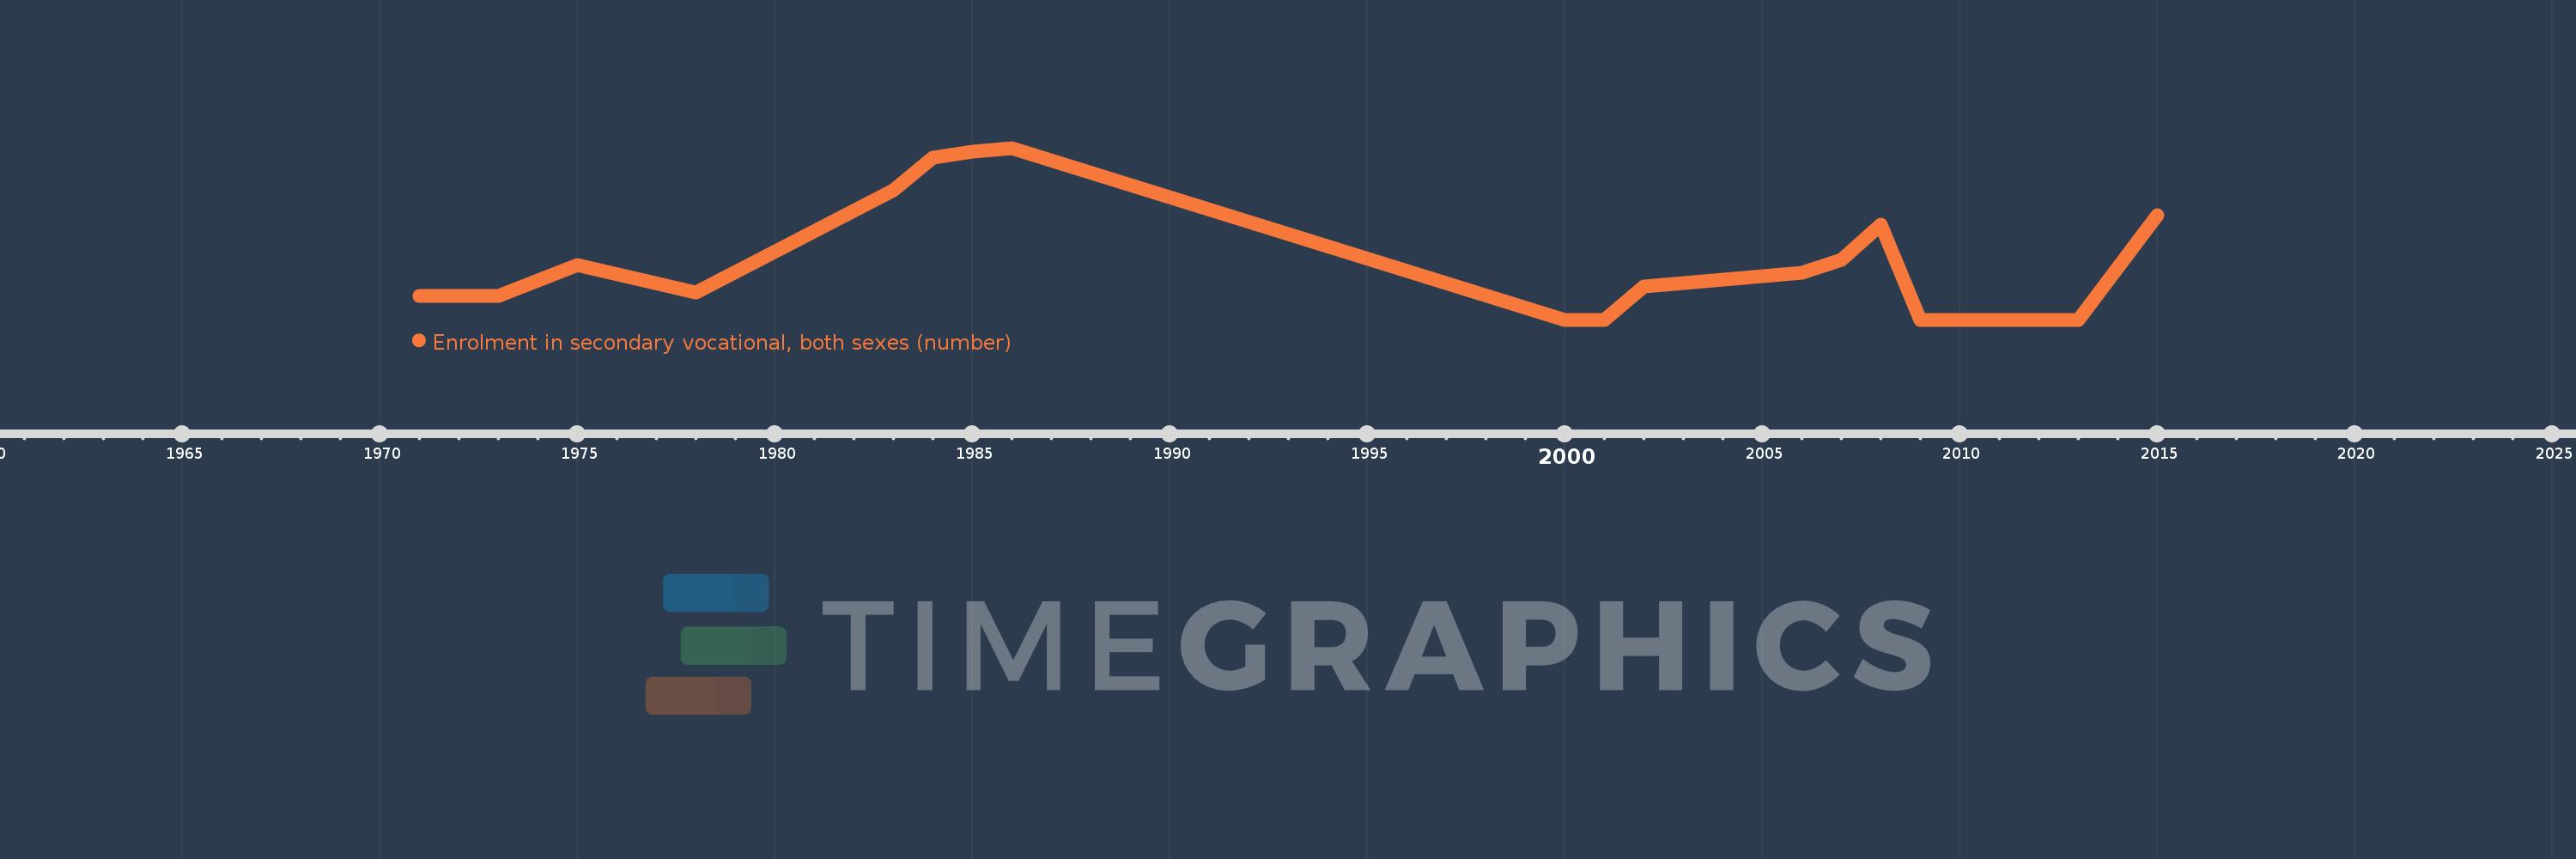
Enrolment in secondary vocational, both sexes (number)
2015,2014,2013,2012,2011,2010,2009,2008,2007,2006,2002,2001,2000,1986,1985,1984,1983,1978,1975,1973,1972,1971