33
/
AIzaSyB4mHJ5NPEv-XzF7P6NDYXjlkCWaeKw5bc
November 30, 2025
127284
Equatorial Guinea
GNQ
true
2
1
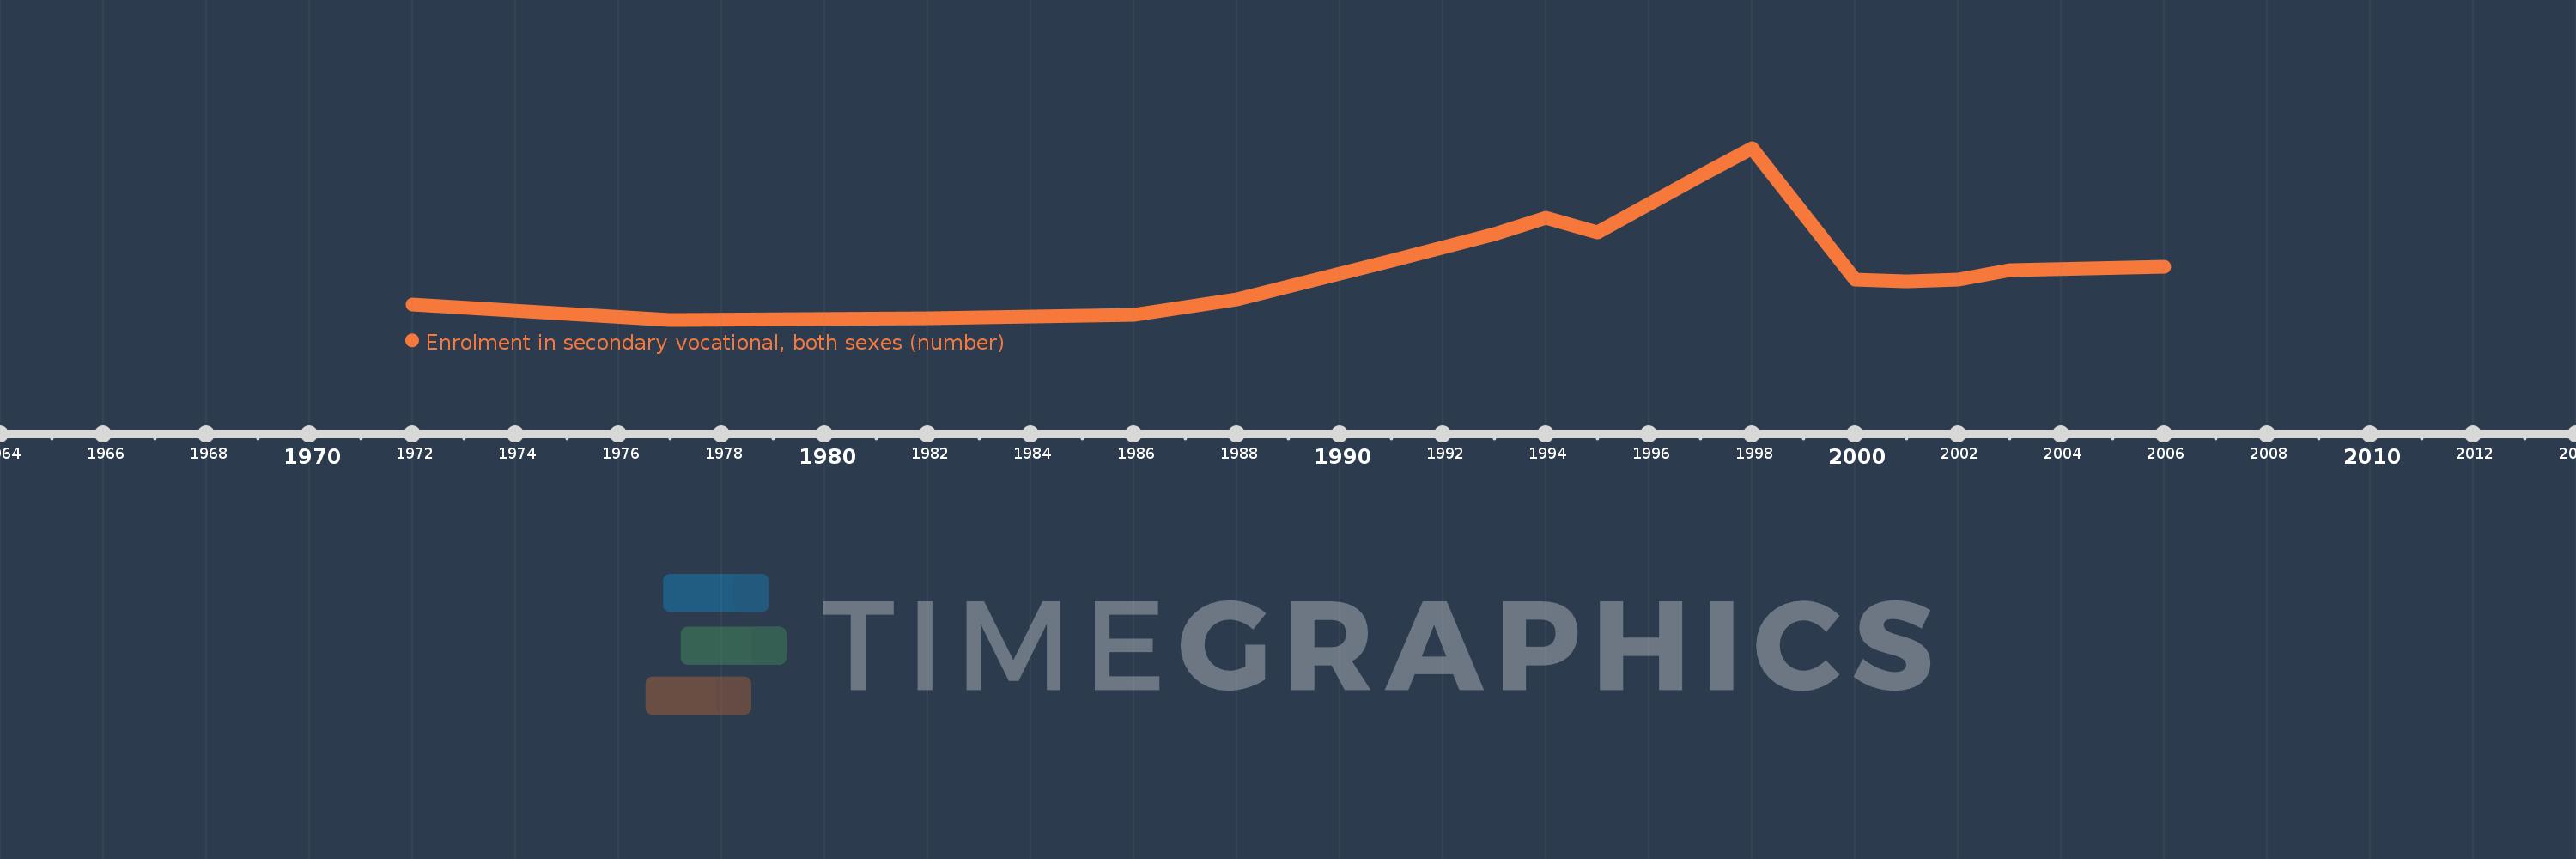
Enrolment in secondary vocational, both sexes (number)
2006,2003,2002,2001,2000,1998,1997,1996,1995,1994,1993,1991,1990,1989,1988,1986,1983,1982,1977,1972