33
/
AIzaSyB4mHJ5NPEv-XzF7P6NDYXjlkCWaeKw5bc
November 30, 2025
78157
Bangladesh
BGD
true
2
1
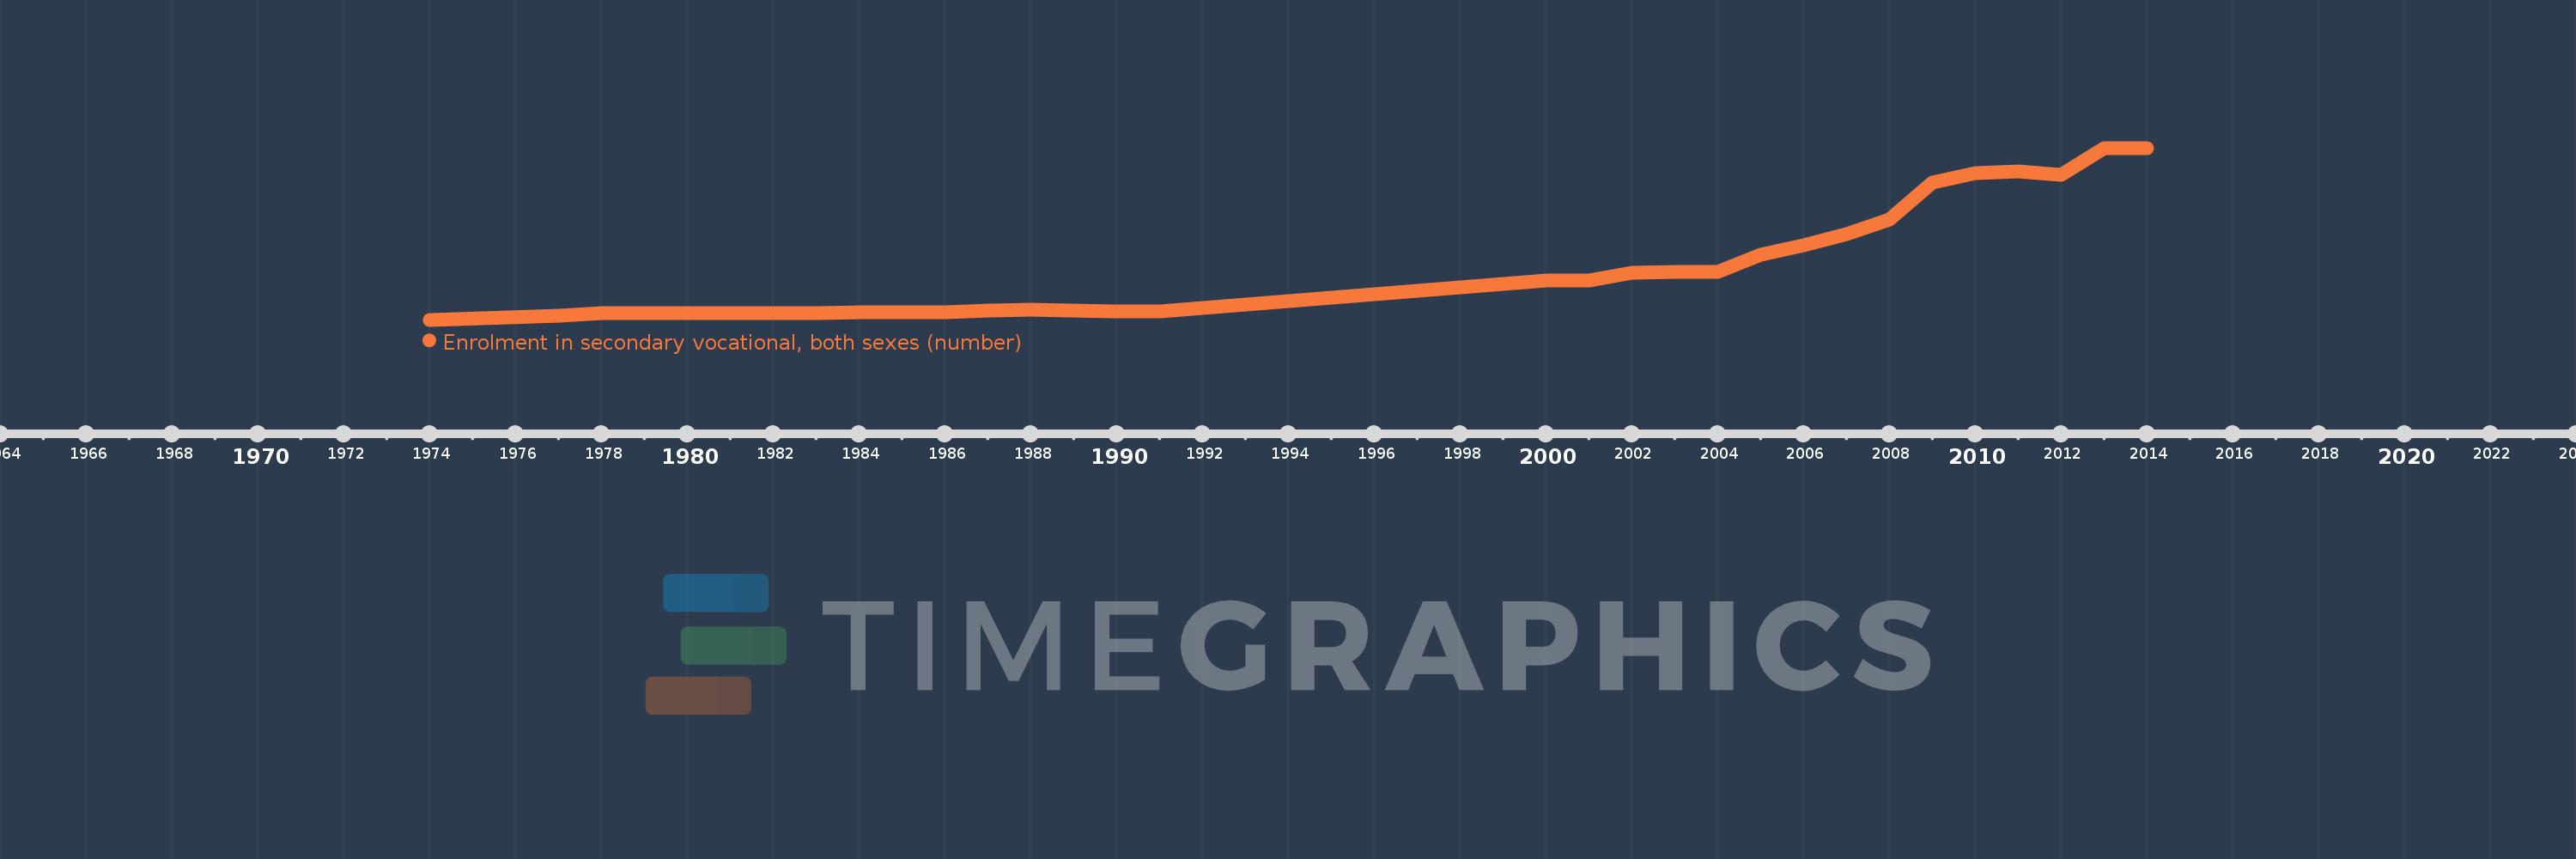
Enrolment in secondary vocational, both sexes (number)
2014,2013,2012,2011,2010,2009,2008,2007,2006,2005,2004,2003,2002,2001,2000,1991,1990,1989,1988,1987,1986,1985,1984,1983,1982,1981,1980,1978,1977,1974