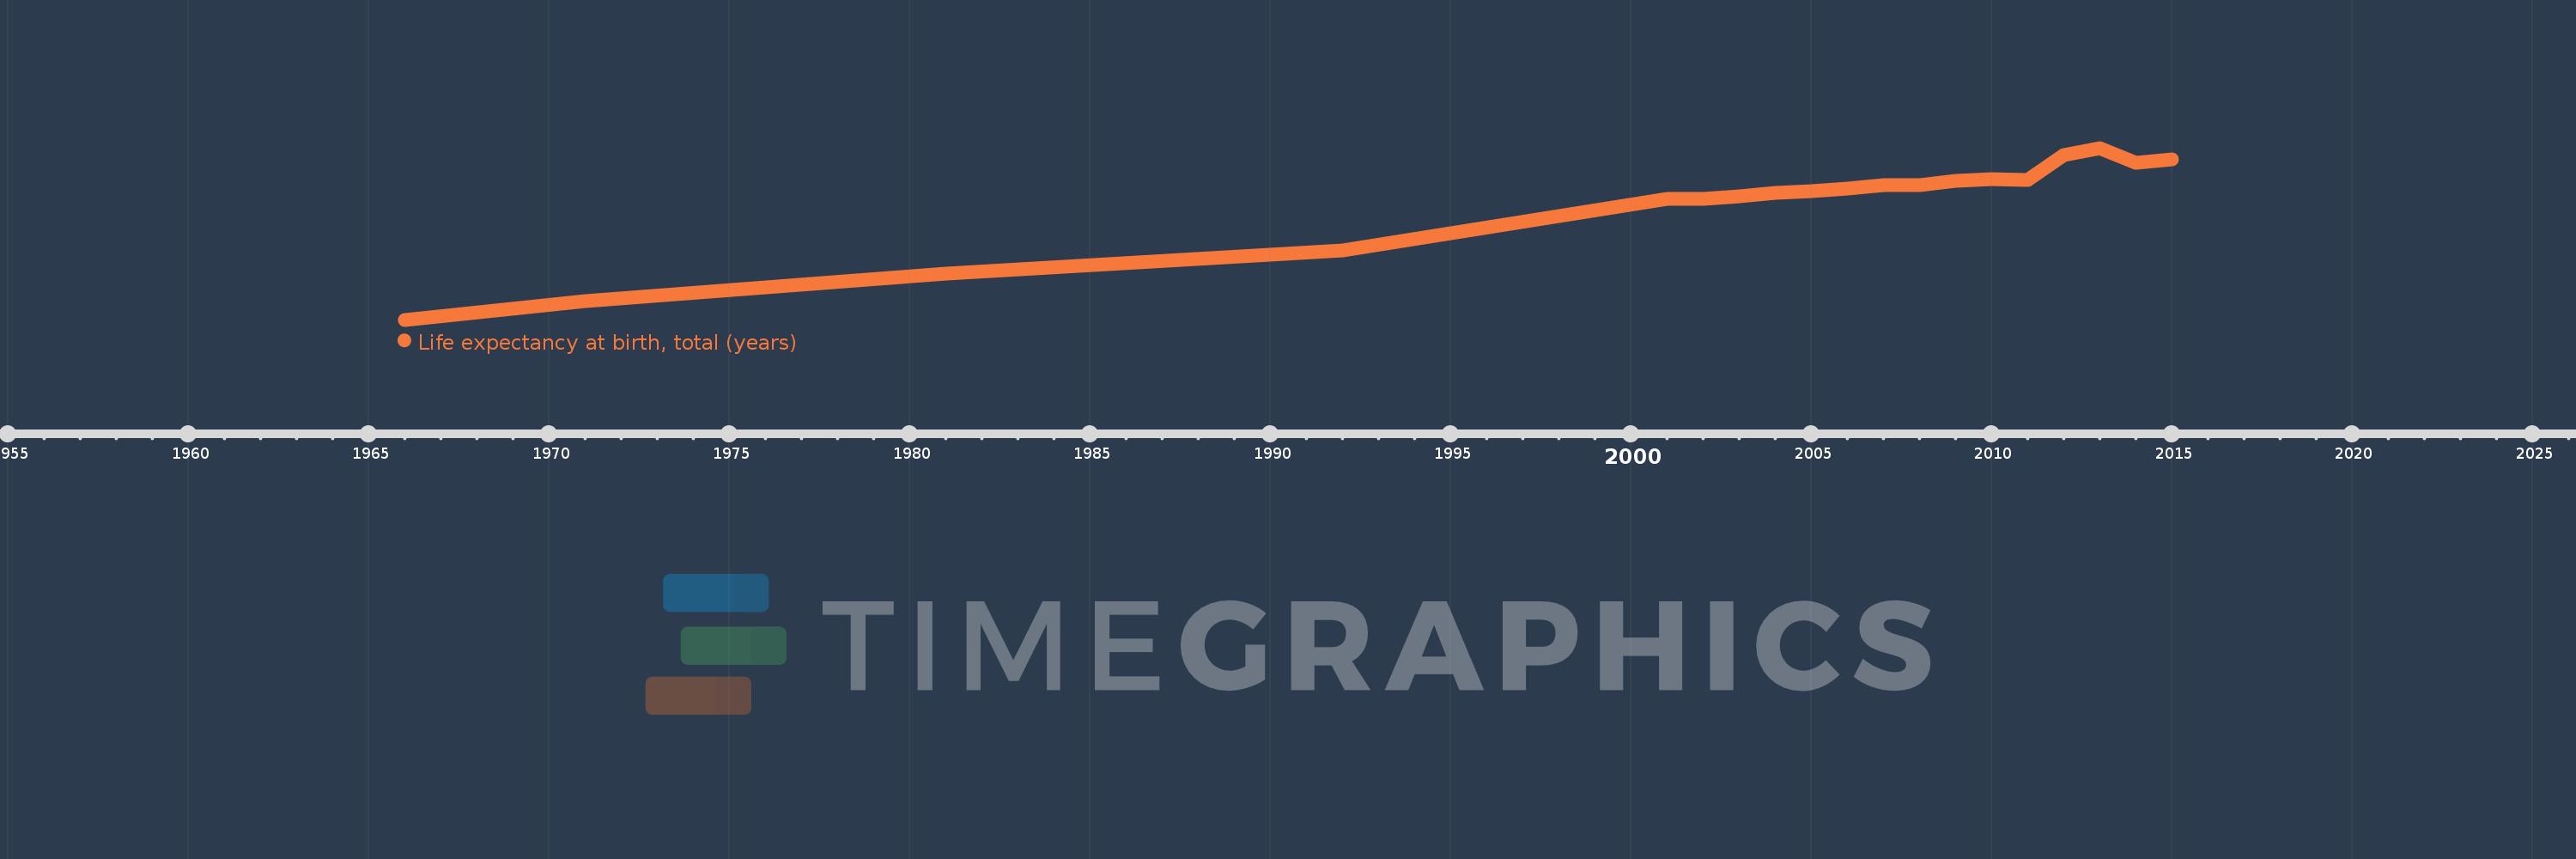
This timeline shows a graph from 1966 to 2015 of Bermuda. No data until 1965. Number of actual observations by date: 19.
Source name:
World Development Indicators
Source organization:
Derived from male and female life expectancy at birth from sources such as: (1) United Nations Population Division. World Population Prospects, (2) Census reports and other statistical publications from national statistical offices, (3) Eurostat: Demographic Statistics, (4) United Nations Statistical Division. Population and Vital Statistics Reprot (various years), (5) U.S. Census Bureau: International Database, and (6) Secretariat of the Pacific Community: Statistics and Demography Programme.
Categories, topics:
Health
Last updated:
apr 23, 2017
Indicators value changes by year
Meaning:
77.622
Minimum:
68.898
jan 1, 1966
Maximum:
81.678
jan 1, 2013
At the date of observation
Value
Absolute change
Change from the previous value
jan 1, 1966
68.898
+68.898
0.0%
jan 1, 1971
70.29
+1.392
2.02%
jan 1, 1981
72.305
+2.015
2.87%
jan 1, 1992
74.03
+1.725
2.39%
jan 1, 2001
77.885
+3.856
5.21%
jan 1, 2002
77.885
0.0
0.0%
jan 1, 2003
78.088
+0.202
0.26%
jan 1, 2004
78.334
+0.246
0.32%
jan 1, 2005
78.485
+0.151
0.19%
jan 1, 2006
78.685
+0.2
0.25%
jan 1, 2007
78.888
+0.202
0.26%
jan 1, 2008
78.934
+0.046
0.06%
jan 1, 2009
79.237
+0.302
0.38%
jan 1, 2010
79.388
+0.152
0.19%
jan 1, 2011
79.289
-0.1
-0.13%
jan 1, 2012
81.153
+1.864
2.35%
jan 1, 2013
81.678
+0.525
0.65%
jan 1, 2014
80.572
-1.105
-1.35%
jan 1, 2015
80.797
+0.225
0.28%
Ranking of countries by current statistics by years