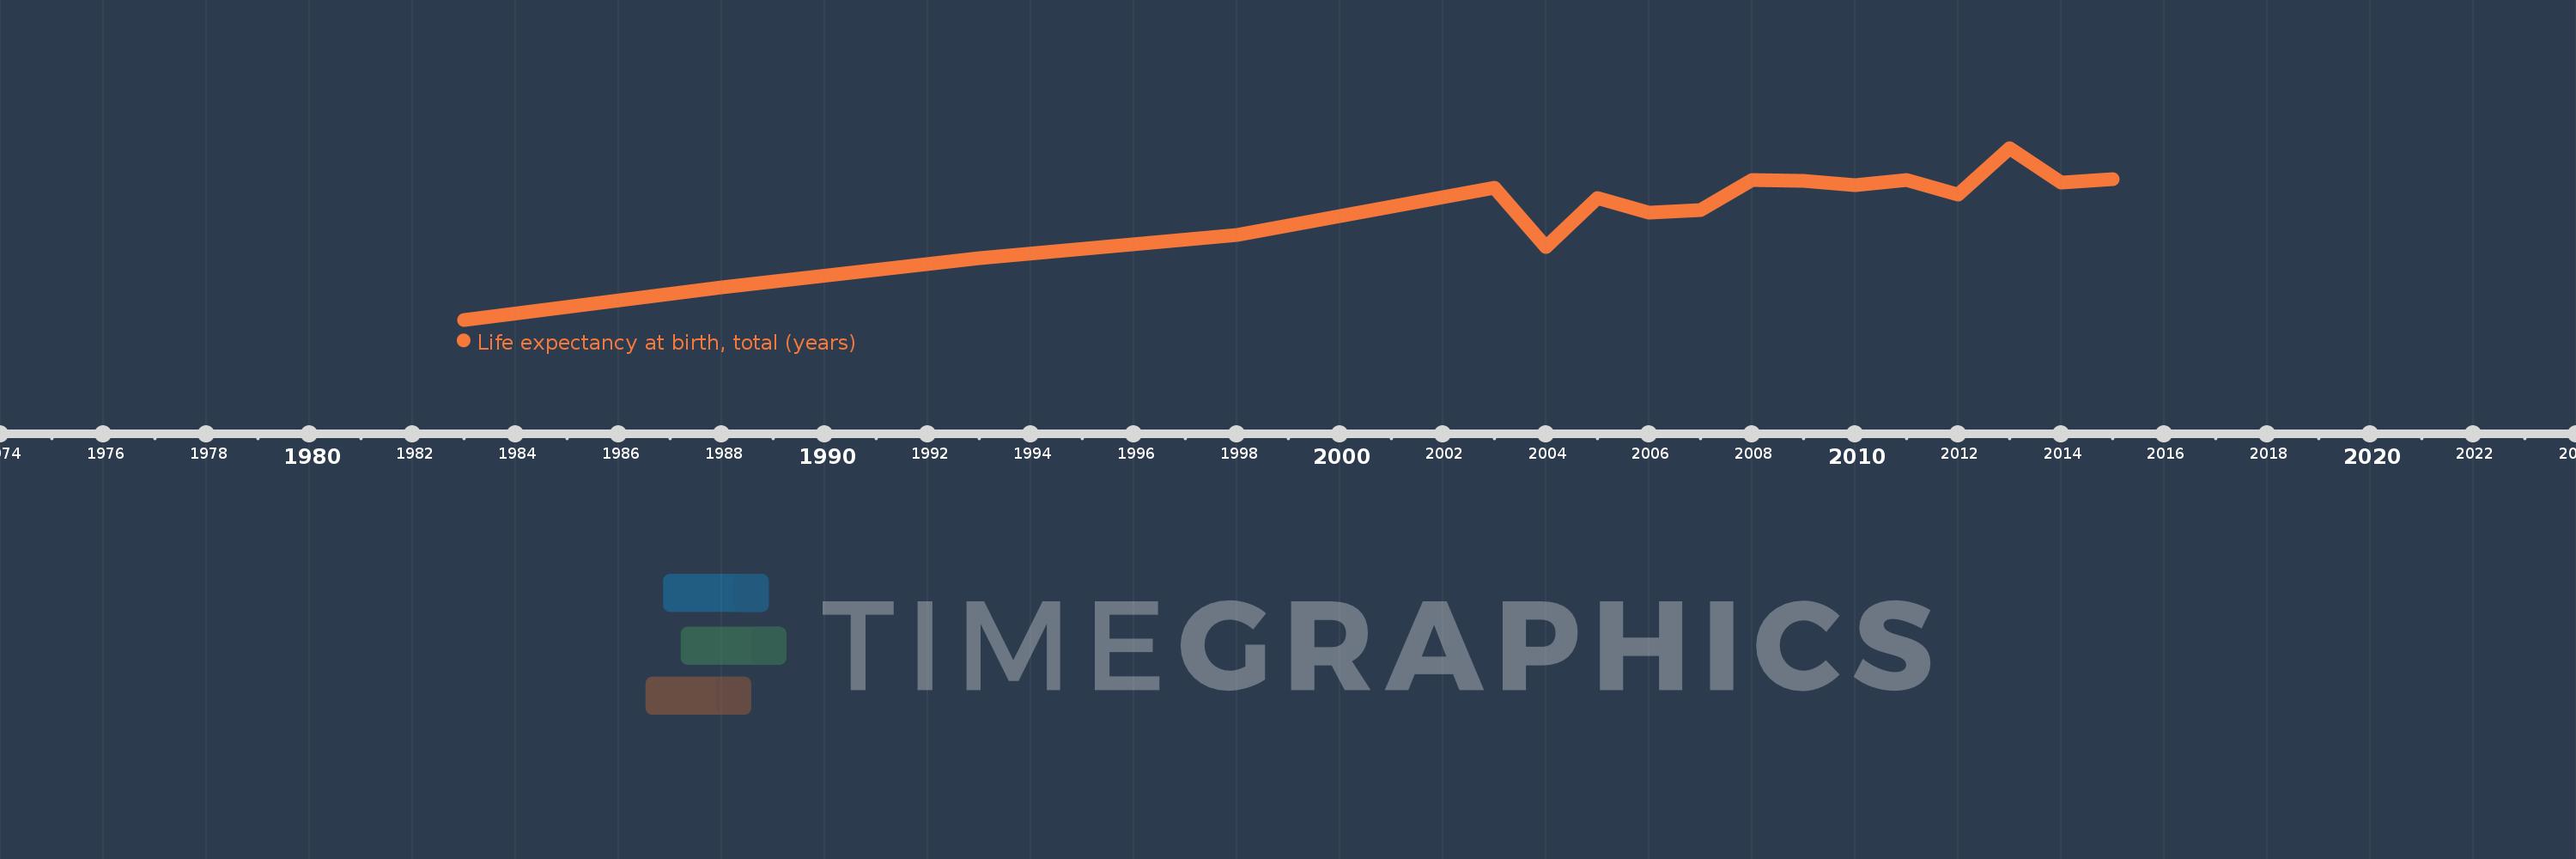
This timeline shows a graph from 1983 to 2015 of Seychelles. No data until 1982. Number of actual observations by date: 17.
Source name:
World Development Indicators
Source organization:
Derived from male and female life expectancy at birth from sources such as: (1) United Nations Population Division. World Population Prospects, (2) Census reports and other statistical publications from national statistical offices, (3) Eurostat: Demographic Statistics, (4) United Nations Statistical Division. Population and Vital Statistics Reprot (various years), (5) U.S. Census Bureau: International Database, and (6) Secretariat of the Pacific Community: Statistics and Demography Programme.
Categories, topics:
Health
Last updated:
apr 23, 2017
Indicators value changes by year
Meaning:
72.196
Minimum:
68.683
jan 1, 1983
Maximum:
74.227
jan 1, 2013
At the date of observation
Value
Absolute change
Change from the previous value
jan 1, 1983
68.683
+68.683
0.0%
jan 1, 1988
69.732
+1.049
1.53%
jan 1, 1993
70.671
+0.939
1.35%
jan 1, 1998
71.415
+0.744
1.05%
jan 1, 2003
72.954
+1.539
2.16%
jan 1, 2004
71.029
-1.924
-2.64%
jan 1, 2005
72.61
+1.58
2.23%
jan 1, 2006
72.132
-0.478
-0.66%
jan 1, 2007
72.217
+0.085
0.12%
jan 1, 2008
73.193
+0.976
1.35%
jan 1, 2009
73.163
-0.029
-0.04%
jan 1, 2010
73.034
-0.129
-0.18%
jan 1, 2011
73.198
+0.163
0.22%
jan 1, 2012
72.724
-0.473
-0.65%
jan 1, 2013
74.227
+1.502
2.07%
jan 1, 2014
73.12
-1.107
-1.49%
jan 1, 2015
73.229
+0.11
0.15%
Ranking of countries by current statistics by years