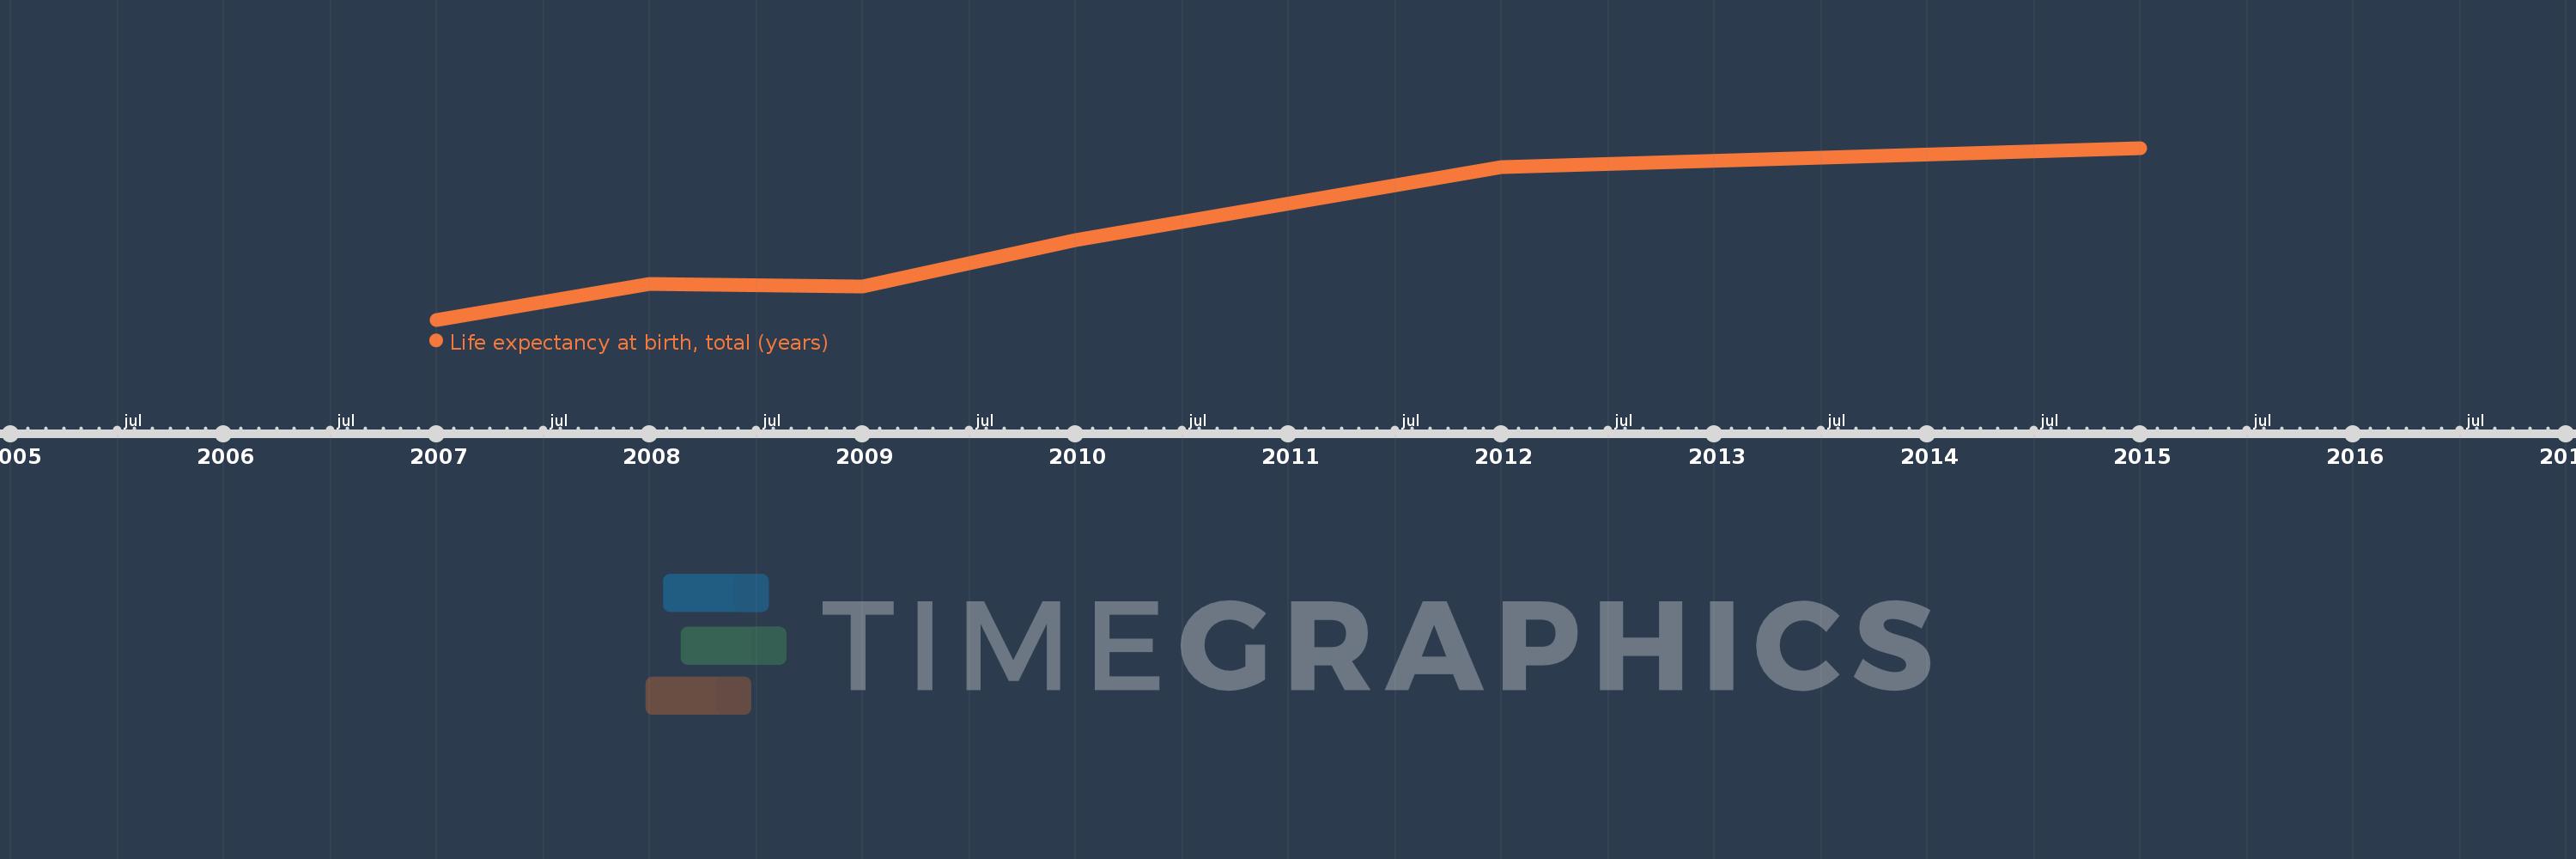
This timeline shows a graph from 2007 to 2015 of Curacao. No data until 2006. Number of actual observations by date: 6.
Source name:
World Development Indicators
Source organization:
Derived from male and female life expectancy at birth from sources such as: (1) United Nations Population Division. World Population Prospects, (2) Census reports and other statistical publications from national statistical offices, (3) Eurostat: Demographic Statistics, (4) United Nations Statistical Division. Population and Vital Statistics Reprot (various years), (5) U.S. Census Bureau: International Database, and (6) Secretariat of the Pacific Community: Statistics and Demography Programme.
Categories, topics:
Health
Last updated:
apr 23, 2017
Indicators value changes by year
Meaning:
76.139
Minimum:
74.71
jan 1, 2007
Maximum:
77.824
jan 1, 2015
At the date of observation
Value
Absolute change
Change from the previous value
jan 1, 2007
74.71
+74.71
0.0%
jan 1, 2008
75.363
+0.654
0.87%
jan 1, 2009
75.31
-0.054
-0.07%
jan 1, 2010
76.156
+0.846
1.12%
jan 1, 2012
77.473
+1.317
1.73%
jan 1, 2015
77.824
+0.351
0.45%
Ranking of countries by current statistics by years