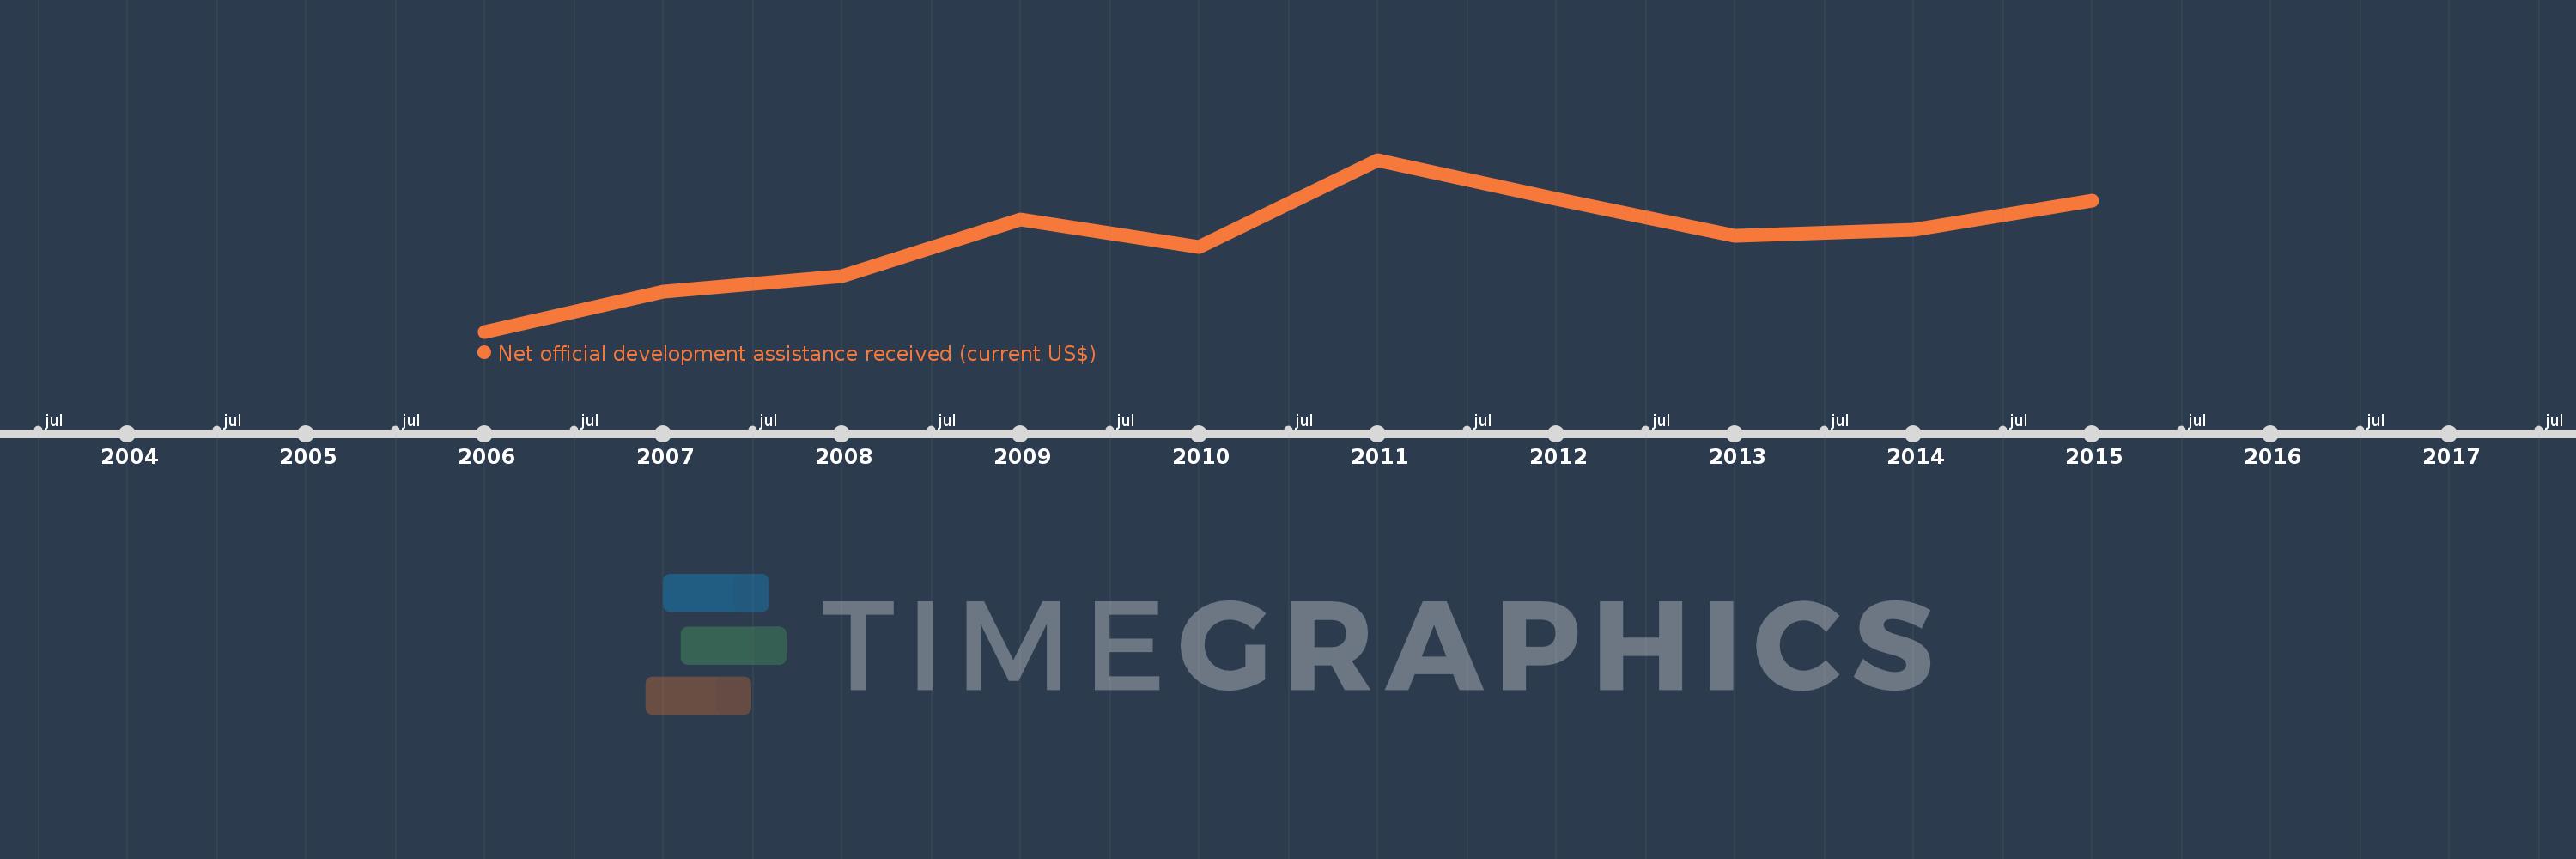
This timeline shows a graph from 2006 to 2015 of Belarus. No data until 2005. Number of actual observations by date: 10.
Source name:
World Development Indicators
Source organization:
Development Assistance Committee of the Organisation for Economic Co-operation and Development, Geographical Distribution of Financial Flows to Developing Countries, Development Co-operation Report, and International Development Statistics database. Data are available online at: www.oecd.org/dac/stats/idsonline.
Categories, topics:
Aid Effectiveness, Economy & Growth, External Debt
Last updated:
apr 23, 2017
Indicators value changes by year
Meaning:
101.334 mln
Minimum:
57.81 mln
jan 1, 2006
Maximum:
138.68 mln
jan 1, 2011
At the date of observation
Value
Absolute change
Change from the previous value
jan 1, 2006
57.81 mln
+57.81 mln
0.0%
jan 1, 2007
76.52 mln
+18.71 mln
32.36%
jan 1, 2008
83.76 mln
+7.24 mln
9.46%
jan 1, 2009
110.42 mln
+26.66 mln
31.83%
jan 1, 2010
97.66 mln
-12.76 mln
-11.56%
jan 1, 2011
138.68 mln
+41.02 mln
42.0%
jan 1, 2012
120.23 mln
-18.45 mln
-13.3%
jan 1, 2013
103.09 mln
-17.14 mln
-14.26%
jan 1, 2014
105.54 mln
+2.45 mln
2.38%
jan 1, 2015
119.63 mln
+14.09 mln
13.35%
Ranking of countries by current statistics by years