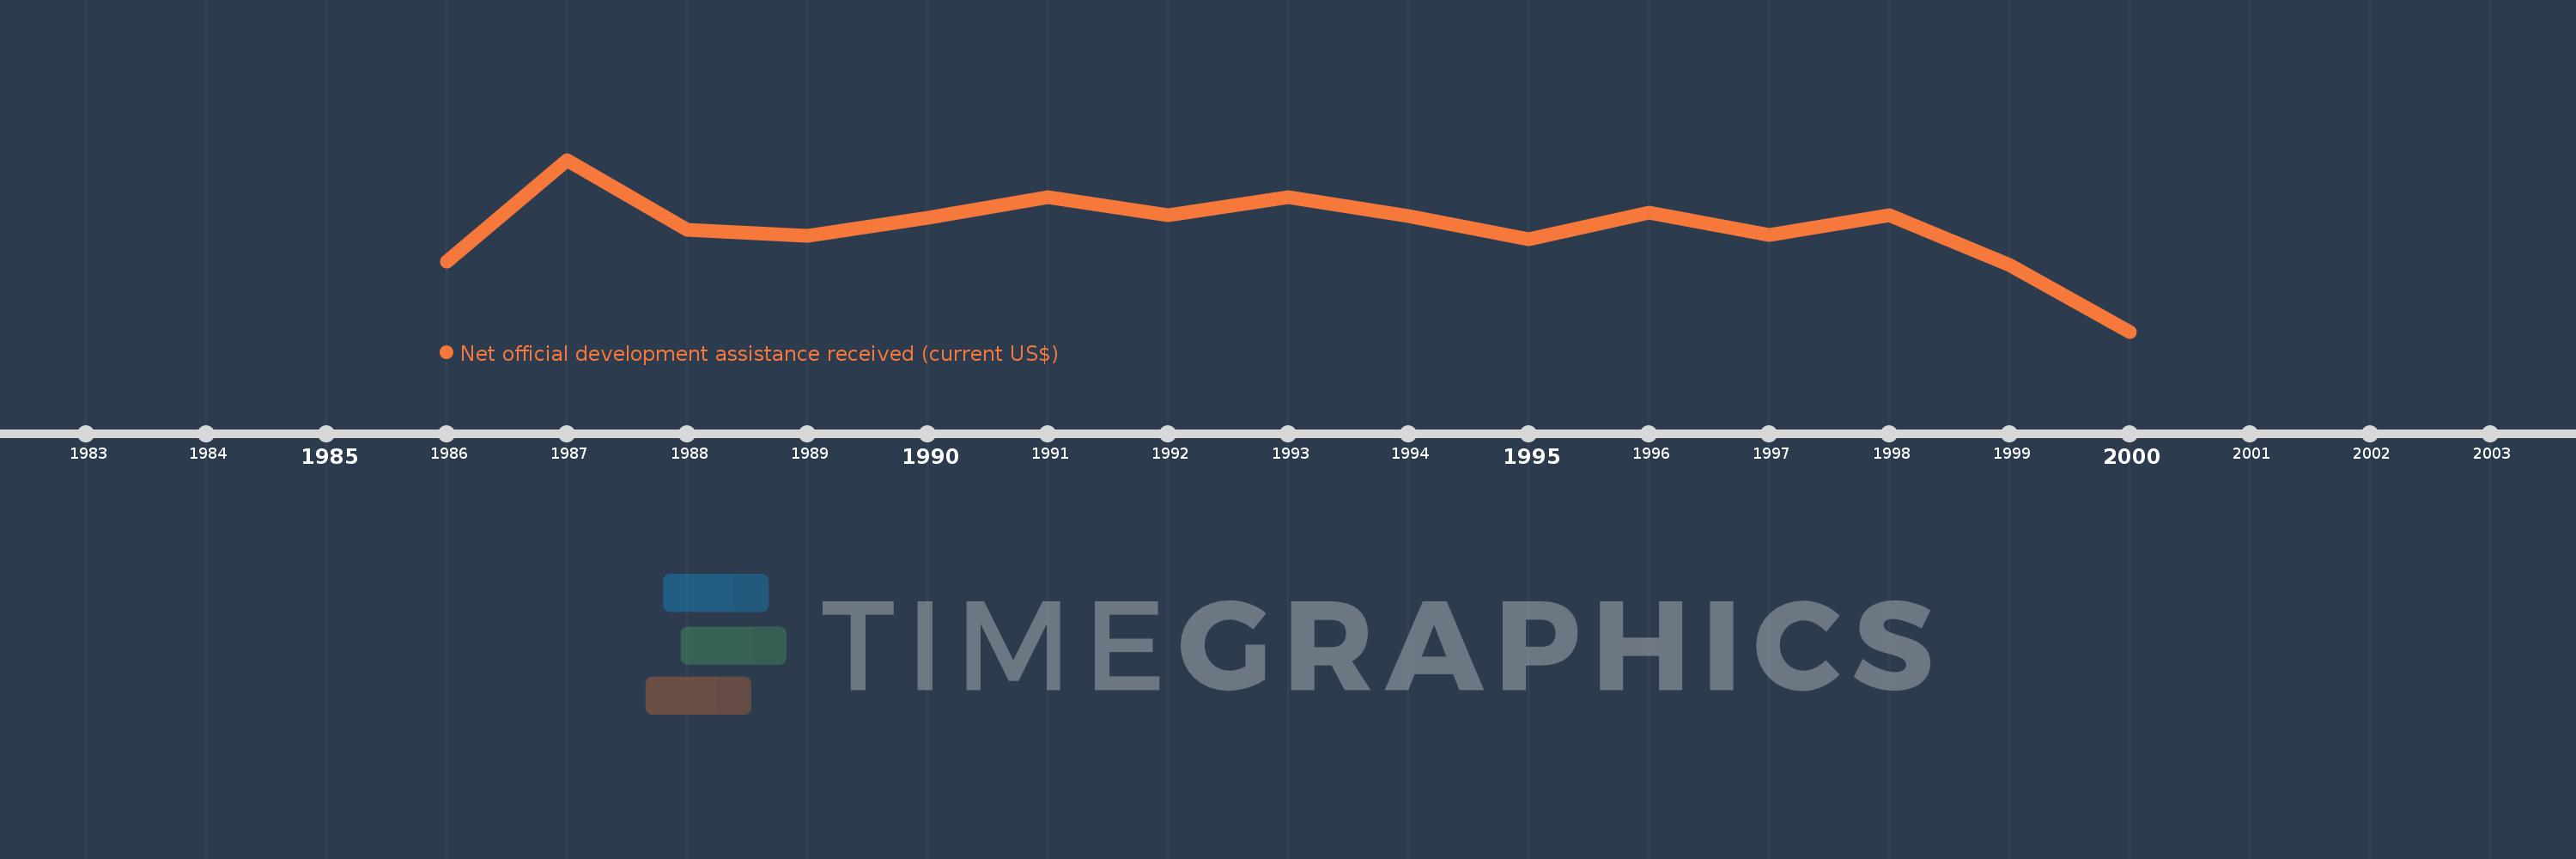
This timeline shows a graph from 1986 to 2000 of Aruba. No data until 1985. Number of actual observations by date: 15.
Source name:
World Development Indicators
Source organization:
Development Assistance Committee of the Organisation for Economic Co-operation and Development, Geographical Distribution of Financial Flows to Developing Countries, Development Co-operation Report, and International Development Statistics database. Data are available online at: www.oecd.org/dac/stats/idsonline.
Categories, topics:
Aid Effectiveness, Economy & Growth, External Debt
Last updated:
apr 23, 2017
Indicators value changes by year
Meaning:
21.289 mln
Minimum:
-7.38 mln
jan 1, 2000
Maximum:
40.43 mln
jan 1, 1987
At the date of observation
Value
Absolute change
Change from the previous value
jan 1, 1986
12.04 mln
+12.04 mln
0.0%
jan 1, 1987
40.43 mln
+28.39 mln
235.8%
jan 1, 1988
20.91 mln
-19.52 mln
-48.28%
jan 1, 1989
19.29 mln
-1.62 mln
-7.75%
jan 1, 1990
24.33 mln
+5.04 mln
26.13%
jan 1, 1991
29.98 mln
+5.65 mln
23.22%
jan 1, 1992
24.97 mln
-5.01 mln
-16.71%
jan 1, 1993
29.98 mln
+5.01 mln
20.06%
jan 1, 1994
24.86 mln
-5.12 mln
-17.08%
jan 1, 1995
18.26 mln
-6.6 mln
-26.55%
jan 1, 1996
25.8 mln
+7.54 mln
41.29%
jan 1, 1997
19.53 mln
-6.27 mln
-24.3%
jan 1, 1998
25.07 mln
+5.54 mln
28.37%
jan 1, 1999
11.26 mln
-13.81 mln
-55.09%
jan 1, 2000
-7.38 mln
-18.64 mln
-165.54%
Ranking of countries by current statistics by years