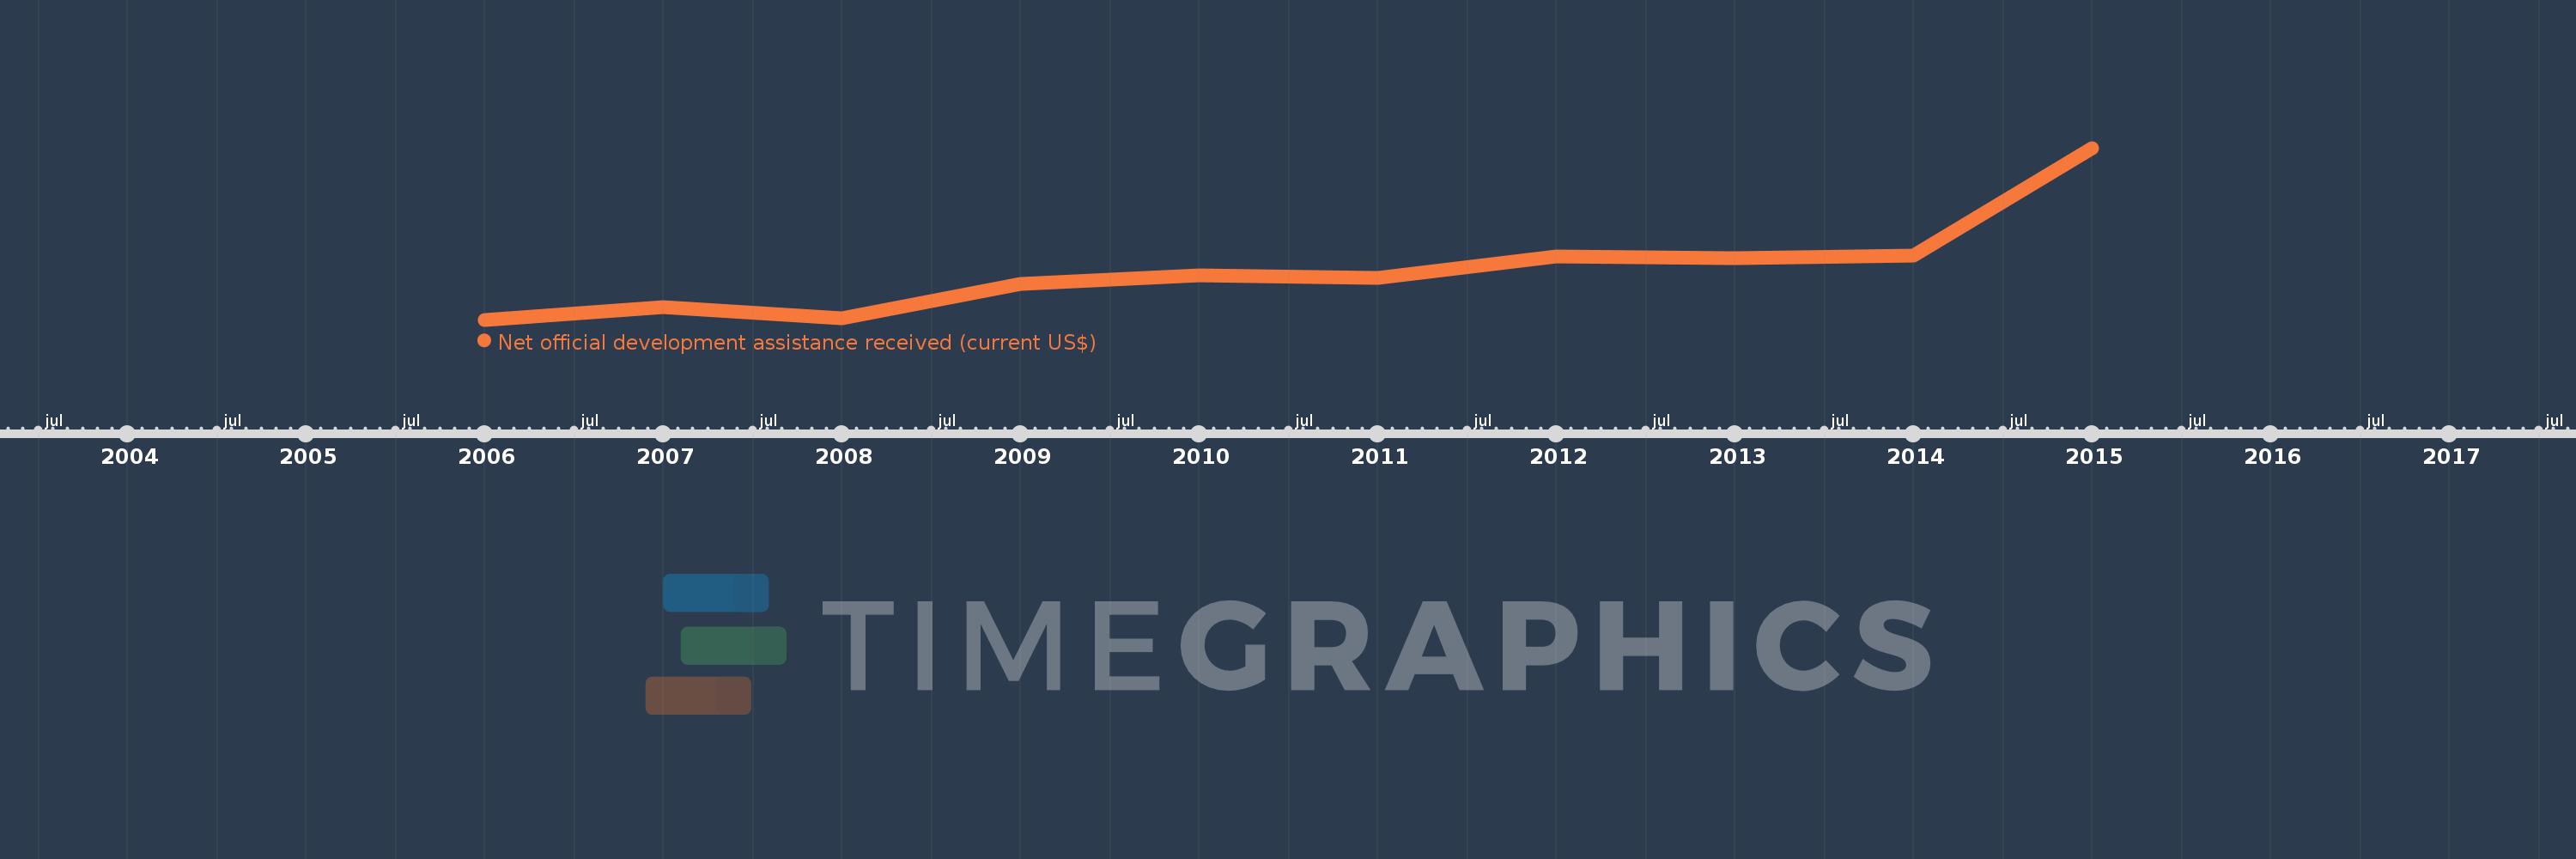
This timeline shows a graph from 2006 to 2015 of Ukraine. No data until 2005. Number of actual observations by date: 10.
Source name:
World Development Indicators
Source organization:
Development Assistance Committee of the Organisation for Economic Co-operation and Development, Geographical Distribution of Financial Flows to Developing Countries, Development Co-operation Report, and International Development Statistics database. Data are available online at: www.oecd.org/dac/stats/idsonline.
Categories, topics:
Aid Effectiveness, Economy & Growth, External Debt
Last updated:
apr 23, 2017
Indicators value changes by year
Meaning:
698.098 mln
Minimum:
411.69 mln
jan 1, 2006
Maximum:
1.404 bln
jan 1, 2015
At the date of observation
Value
Absolute change
Change from the previous value
jan 1, 2006
411.69 mln
+411.69 mln
0.0%
jan 1, 2007
483.5 mln
+71.81 mln
17.44%
jan 1, 2008
420.28 mln
-63.22 mln
-13.08%
jan 1, 2009
617.97 mln
+197.69 mln
47.04%
jan 1, 2010
666.25 mln
+48.28 mln
7.81%
jan 1, 2011
651.38 mln
-14.87 mln
-2.23%
jan 1, 2012
775.15 mln
+123.77 mln
19.0%
jan 1, 2013
767.6 mln
-7.55 mln
-0.97%
jan 1, 2014
783.48 mln
+15.88 mln
2.07%
jan 1, 2015
1.404 bln
+620.2 mln
79.16%
Ranking of countries by current statistics by years