33
/
AIzaSyB4mHJ5NPEv-XzF7P6NDYXjlkCWaeKw5bc
November 30, 2025
75559
Azerbaijan
AZE
true
2
1
PPG, IDA (NTR, current US$)
2016,2015,2014,2013,2012,2011,2010,2009,2008,2007,2006,2005,2004,2003,2002,2001,2000,1999,1998,1997,1996
Create a timeline
Public Timelines
For education
For educational institutions
For teachers
For students
Cabinet
For educational institutions
For teachers
For students
Open cabinet
FAQ
Close
Create a timeline
Public timelines
FAQ
About & Feedback
Terms
Privacy
FAQ
Support 24/7
Cabinet
Get premium
Donate
Download
Global statistics library
→
Azerbaijan
→
PPG, IDA (NTR, current US$)
This statistics in other country:
Afghanistan
Albania
Angola
Armenia
Azerbaijan
Bangladesh
Benin
Bhutan
Bolivia
Bosnia and Herzegovina
Botswana
Burkina Faso
Burundi
Cabo Verde
Cambodia
Cameroon
Central African Republic
Chad
China
Colombia
Comoros
Congo, Dem. Rep.
Congo, Rep.
Costa Rica
Cote d'Ivoire
Djibouti
Dominica
Dominican Republic
East Asia & Pacific (excluding high income)
Ecuador
Egypt, Arab Rep.
El Salvador
Eritrea
Ethiopia
Europe & Central Asia (excluding high income)
Gambia, The
Georgia
Ghana
Grenada
Guinea
Guinea-Bissau
Guyana
Haiti
Honduras
IDA only
India
Indonesia
Jordan
Kenya
Kosovo
Kyrgyz Republic
Lao PDR
Latin America & Caribbean (excluding high income)
Lesotho
Liberia
Low & middle income
Low income
Lower middle income
Macedonia, FYR
Madagascar
Malawi
Maldives
Mali
Mauritania
Mauritius
Middle East & North Africa (excluding high income)
Middle income
Moldova
Mongolia
Montenegro
Morocco
Mozambique
Myanmar
Nepal
Nicaragua
Niger
Nigeria
Pakistan
Papua New Guinea
Paraguay
Philippines
Rwanda
Samoa
Sao Tome and Principe
Senegal
Serbia
Sierra Leone
Solomon Islands
Somalia
South Asia
Sri Lanka
St. Lucia
St. Vincent and the Grenadines
Sub-Saharan Africa (excluding high income)
Sudan
Swaziland
Syrian Arab Republic
Tajikistan
Tanzania
Thailand
Togo
Tonga
Tunisia
Turkey
Uganda
Upper middle income
Uzbekistan
Vanuatu
Vietnam
Yemen, Rep.
Zambia
Zimbabwe
Timeline:
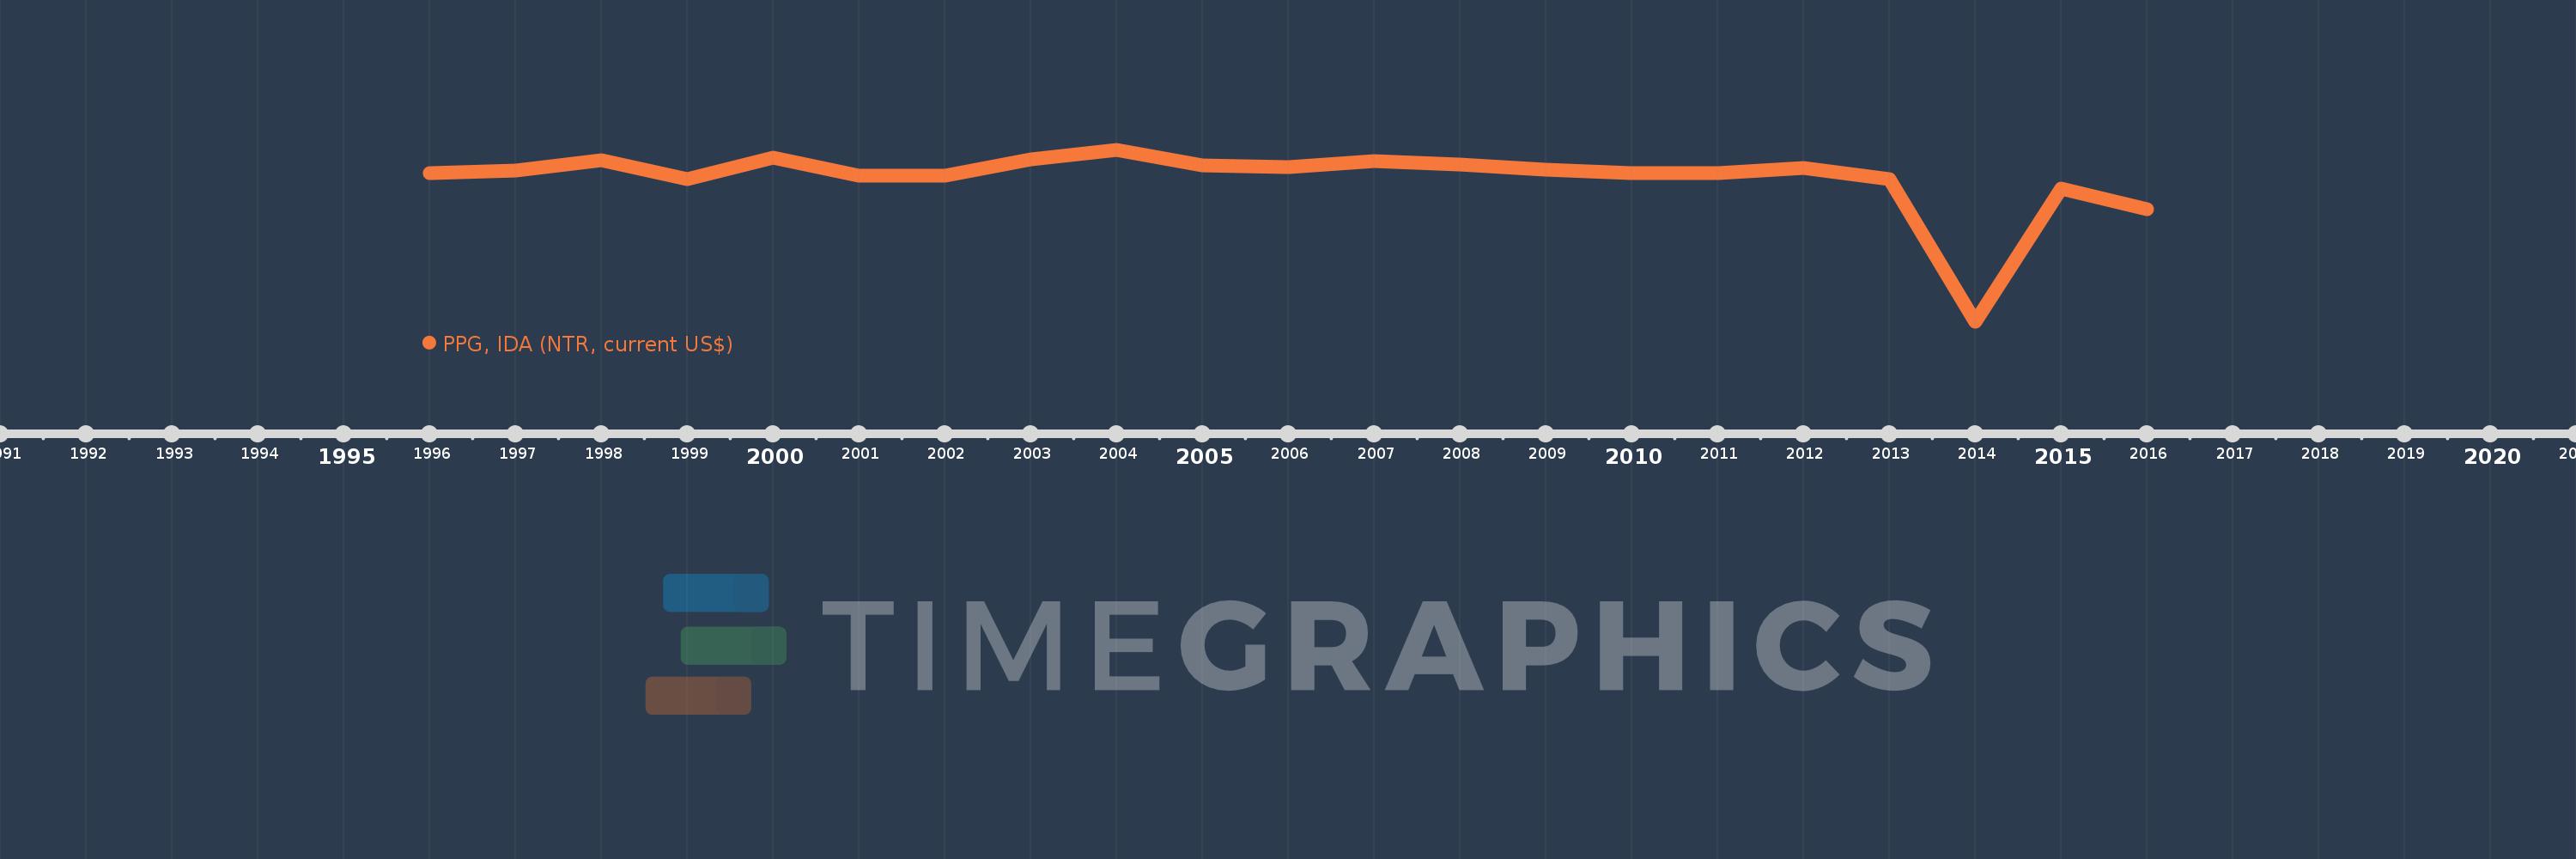
This timeline shows a graph from
1996
to
2016
of Azerbaijan. No data until
1995
. Number of actual observations by date:
21
.
Source name:
World Development Indicators
Source organization:
World Bank, International Debt Statistics.
Categories, topics:
External Debt
Last updated:
apr 23, 2017
Indicators value changes by year
Meaning:
21.7 mln
Minimum:
-237.149 mln
jan 1, 2014
Maximum:
72.278 mln
jan 1, 2004
At the date of observation
Value
Absolute change
Change from the previous value
jan 1, 1996
30.204 mln
+30.204 mln
0.0%
jan 1, 1997
35.498 mln
+5.294 mln
17.53%
jan 1, 1998
54.865 mln
+19.367 mln
54.56%
jan 1, 1999
19.717 mln
-35.148 mln
-64.06%
jan 1, 2000
59.274 mln
+39.557 mln
200.62%
jan 1, 2001
25.689 mln
-33.585 mln
-56.66%
jan 1, 2002
25.918 mln
+229.0K
0.89%
jan 1, 2003
54.986 mln
+29.068 mln
112.15%
jan 1, 2004
72.278 mln
+17.292 mln
31.45%
jan 1, 2005
44.977 mln
-27.301 mln
-37.77%
jan 1, 2006
41.372 mln
-3.605 mln
-8.02%
jan 1, 2007
51.858 mln
+10.486 mln
25.35%
jan 1, 2008
47.105 mln
-4.753 mln
-9.17%
jan 1, 2009
36.849 mln
-10.256 mln
-21.77%
jan 1, 2010
30.872 mln
-5.977 mln
-16.22%
jan 1, 2011
30.351 mln
-521.0K
-1.69%
jan 1, 2012
40.327 mln
+9.976 mln
32.87%
jan 1, 2013
20.244 mln
-20.083 mln
-49.8%
jan 1, 2014
-237.149 mln
-257.393 mln
-1.27K%
jan 1, 2015
3.726 mln
+240.875 mln
-101.57%
jan 1, 2016
-33.261 mln
-36.987 mln
-992.67%
Ranking of countries by current statistics by years
About & Feedback
Terms
Privacy
FAQ
Support 24/7
Cabinet
Get premium
Donate
The service accepts bank transfer (ACH, Wire) or cards (Visa, MasterCard, etc). Processed by Stripe.
Secured with SSL