33
/
AIzaSyB4mHJ5NPEv-XzF7P6NDYXjlkCWaeKw5bc
November 30, 2025
199700
Mongolia
MNG
true
2
1
PPG, IDA (NTR, current US$)
2016,2015,2014,2013,2012,2011,2010,2009,2008,2007,2006,2005,2004,2003,2002,2001,2000,1999,1998,1997,1996,1995,1994,1993
Create a timeline
Public Timelines
For education
For educational institutions
For teachers
For students
Cabinet
For educational institutions
For teachers
For students
Open cabinet
FAQ
Close
Create a timeline
Public timelines
FAQ
About & Feedback
Terms
Privacy
FAQ
Support 24/7
Cabinet
Get premium
Donate
Download
Global statistics library
→
Mongolia
→
PPG, IDA (NTR, current US$)
This statistics in other country:
Afghanistan
Albania
Angola
Armenia
Azerbaijan
Bangladesh
Benin
Bhutan
Bolivia
Bosnia and Herzegovina
Botswana
Burkina Faso
Burundi
Cabo Verde
Cambodia
Cameroon
Central African Republic
Chad
China
Colombia
Comoros
Congo, Dem. Rep.
Congo, Rep.
Costa Rica
Cote d'Ivoire
Djibouti
Dominica
Dominican Republic
East Asia & Pacific (excluding high income)
Ecuador
Egypt, Arab Rep.
El Salvador
Eritrea
Ethiopia
Europe & Central Asia (excluding high income)
Gambia, The
Georgia
Ghana
Grenada
Guinea
Guinea-Bissau
Guyana
Haiti
Honduras
IDA only
India
Indonesia
Jordan
Kenya
Kosovo
Kyrgyz Republic
Lao PDR
Latin America & Caribbean (excluding high income)
Lesotho
Liberia
Low & middle income
Low income
Lower middle income
Macedonia, FYR
Madagascar
Malawi
Maldives
Mali
Mauritania
Mauritius
Middle East & North Africa (excluding high income)
Middle income
Moldova
Mongolia
Montenegro
Morocco
Mozambique
Myanmar
Nepal
Nicaragua
Niger
Nigeria
Pakistan
Papua New Guinea
Paraguay
Philippines
Rwanda
Samoa
Sao Tome and Principe
Senegal
Serbia
Sierra Leone
Solomon Islands
Somalia
South Asia
Sri Lanka
St. Lucia
St. Vincent and the Grenadines
Sub-Saharan Africa (excluding high income)
Sudan
Swaziland
Syrian Arab Republic
Tajikistan
Tanzania
Thailand
Togo
Tonga
Tunisia
Turkey
Uganda
Upper middle income
Uzbekistan
Vanuatu
Vietnam
Yemen, Rep.
Zambia
Zimbabwe
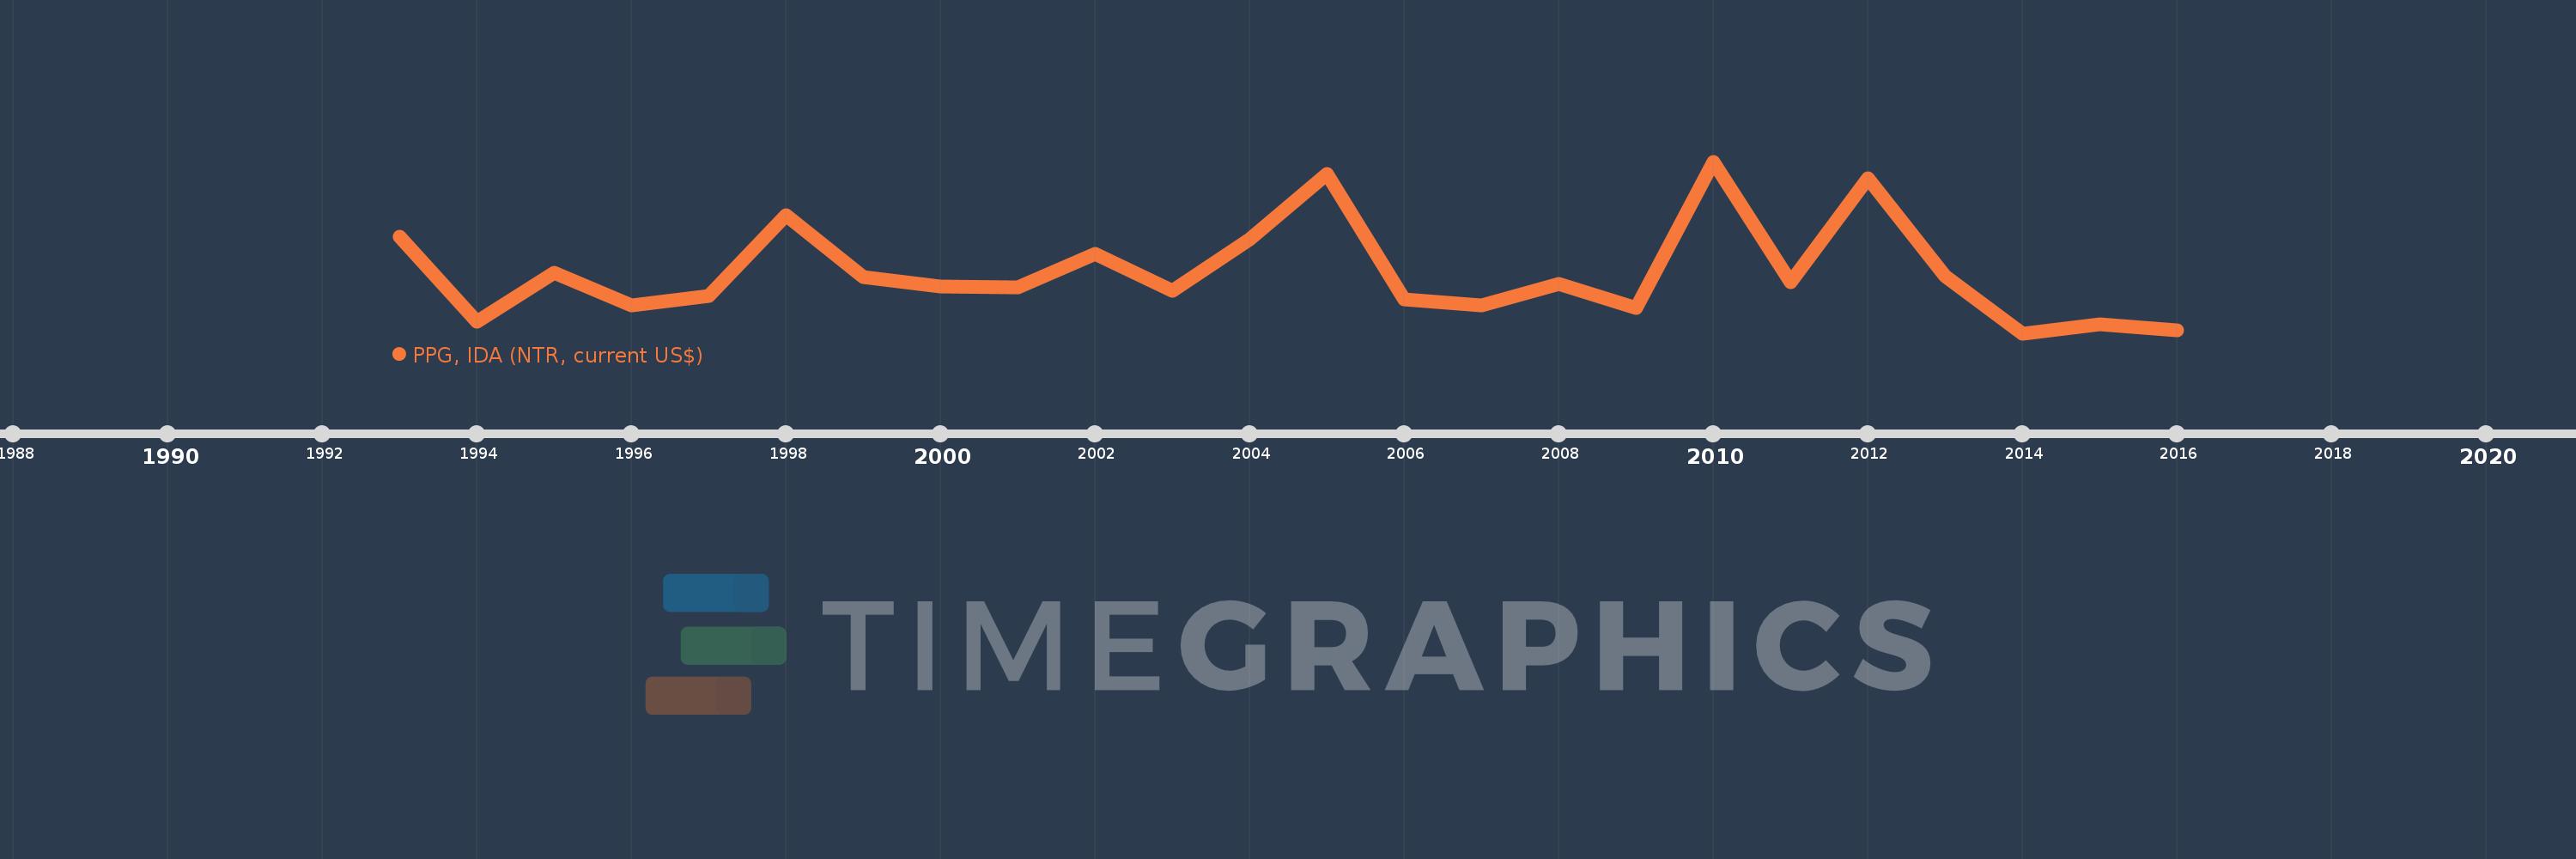
Timeline:
This timeline shows a graph from
1993
to
2016
of Mongolia. No data until
1992
. Number of actual observations by date:
24
.
Source name:
World Development Indicators
Source organization:
World Bank, International Debt Statistics.
Categories, topics:
External Debt
Last updated:
apr 23, 2017
Indicators value changes by year
Meaning:
17.214 mln
Minimum:
78.0K
jan 1, 2014
Maximum:
48.497 mln
jan 1, 2010
At the date of observation
Value
Absolute change
Change from the previous value
jan 1, 1993
27.3 mln
+27.3 mln
0.0%
jan 1, 1994
3.233 mln
-24.067 mln
-88.16%
jan 1, 1995
17.133 mln
+13.9 mln
429.94%
jan 1, 1996
7.996 mln
-9.137 mln
-53.33%
jan 1, 1997
10.501 mln
+2.505 mln
31.33%
jan 1, 1998
33.25 mln
+22.749 mln
216.64%
jan 1, 1999
16.017 mln
-17.233 mln
-51.83%
jan 1, 2000
13.32 mln
-2.697 mln
-16.84%
jan 1, 2001
13.095 mln
-225.0K
-1.69%
jan 1, 2002
22.454 mln
+9.359 mln
71.47%
jan 1, 2003
12.063 mln
-10.391 mln
-46.28%
jan 1, 2004
26.469 mln
+14.406 mln
119.42%
jan 1, 2005
44.942 mln
+18.473 mln
69.79%
jan 1, 2006
9.699 mln
-35.243 mln
-78.42%
jan 1, 2007
8.048 mln
-1.651 mln
-17.02%
jan 1, 2008
13.97 mln
+5.922 mln
73.58%
jan 1, 2009
7.266 mln
-6.704 mln
-47.99%
jan 1, 2010
48.497 mln
+41.231 mln
567.45%
jan 1, 2011
14.506 mln
-33.991 mln
-70.09%
jan 1, 2012
43.67 mln
+29.164 mln
201.05%
jan 1, 2013
16.155 mln
-27.515 mln
-63.01%
jan 1, 2014
78.0K
-16.077 mln
-99.52%
jan 1, 2015
2.51 mln
+2.432 mln
3.12K%
jan 1, 2016
960.0K
-1.55 mln
-61.75%
Ranking of countries by current statistics by years
About & Feedback
Terms
Privacy
FAQ
Support 24/7
Cabinet
Get premium
Donate
The service accepts bank transfer (ACH, Wire) or cards (Visa, MasterCard, etc). Processed by Stripe.
Secured with SSL