33
/
AIzaSyB4mHJ5NPEv-XzF7P6NDYXjlkCWaeKw5bc
November 30, 2025
68252
Angola
AGO
true
2
1
PPG, IDA (NTR, current US$)
2016,2015,2014,2013,2012,2011,2010,2009,2008,2007,2006,2005,2004,2003,2002,2001,2000,1999,1998,1997,1996,1995,1994,1993
Create a timeline
Public Timelines
For education
For educational institutions
For teachers
For students
Cabinet
For educational institutions
For teachers
For students
Open cabinet
FAQ
Close
Create a timeline
Public timelines
FAQ
About & Feedback
Terms
Privacy
FAQ
Support 24/7
Cabinet
Get premium
Donate
Download
Global statistics library
→
Angola
→
PPG, IDA (NTR, current US$)
This statistics in other country:
Afghanistan
Albania
Angola
Armenia
Azerbaijan
Bangladesh
Benin
Bhutan
Bolivia
Bosnia and Herzegovina
Botswana
Burkina Faso
Burundi
Cabo Verde
Cambodia
Cameroon
Central African Republic
Chad
China
Colombia
Comoros
Congo, Dem. Rep.
Congo, Rep.
Costa Rica
Cote d'Ivoire
Djibouti
Dominica
Dominican Republic
East Asia & Pacific (excluding high income)
Ecuador
Egypt, Arab Rep.
El Salvador
Eritrea
Ethiopia
Europe & Central Asia (excluding high income)
Gambia, The
Georgia
Ghana
Grenada
Guinea
Guinea-Bissau
Guyana
Haiti
Honduras
IDA only
India
Indonesia
Jordan
Kenya
Kosovo
Kyrgyz Republic
Lao PDR
Latin America & Caribbean (excluding high income)
Lesotho
Liberia
Low & middle income
Low income
Lower middle income
Macedonia, FYR
Madagascar
Malawi
Maldives
Mali
Mauritania
Mauritius
Middle East & North Africa (excluding high income)
Middle income
Moldova
Mongolia
Montenegro
Morocco
Mozambique
Myanmar
Nepal
Nicaragua
Niger
Nigeria
Pakistan
Papua New Guinea
Paraguay
Philippines
Rwanda
Samoa
Sao Tome and Principe
Senegal
Serbia
Sierra Leone
Solomon Islands
Somalia
South Asia
Sri Lanka
St. Lucia
St. Vincent and the Grenadines
Sub-Saharan Africa (excluding high income)
Sudan
Swaziland
Syrian Arab Republic
Tajikistan
Tanzania
Thailand
Togo
Tonga
Tunisia
Turkey
Uganda
Upper middle income
Uzbekistan
Vanuatu
Vietnam
Yemen, Rep.
Zambia
Zimbabwe
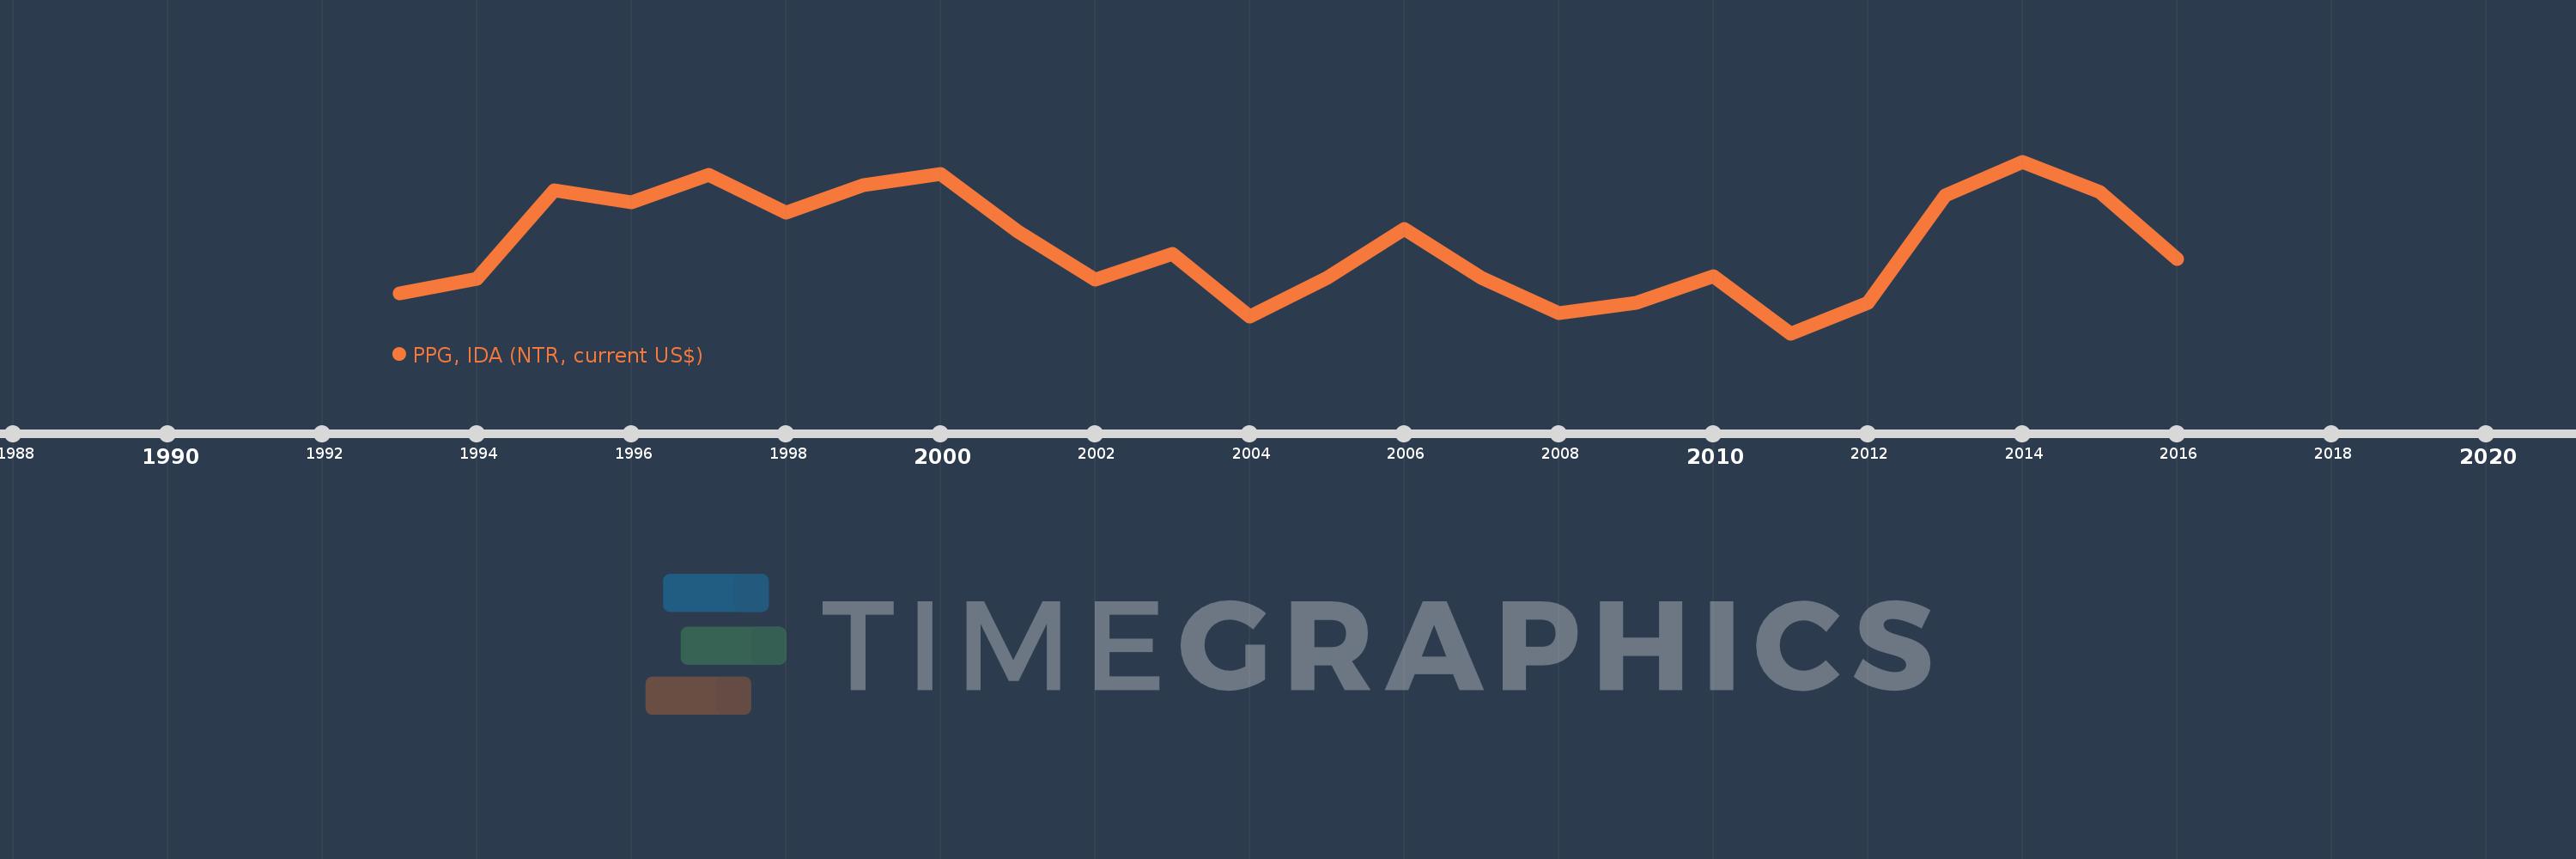
Timeline:
This timeline shows a graph from
1993
to
2016
of Angola. No data until
1992
. Number of actual observations by date:
24
.
Source name:
World Development Indicators
Source organization:
World Bank, International Debt Statistics.
Categories, topics:
External Debt
Last updated:
apr 23, 2017
Indicators value changes by year
Meaning:
18.185 mln
Minimum:
-4.763 mln
jan 1, 2011
Maximum:
40.63 mln
jan 1, 2014
At the date of observation
Value
Absolute change
Change from the previous value
jan 1, 1993
5.717 mln
+5.717 mln
0.0%
jan 1, 1994
9.604 mln
+3.887 mln
67.99%
jan 1, 1995
33.126 mln
+23.522 mln
244.92%
jan 1, 1996
29.944 mln
-3.182 mln
-9.61%
jan 1, 1997
37.099 mln
+7.155 mln
23.89%
jan 1, 1998
27.095 mln
-10.004 mln
-26.97%
jan 1, 1999
34.46 mln
+7.365 mln
27.18%
jan 1, 2000
37.442 mln
+2.982 mln
8.65%
jan 1, 2001
22.098 mln
-15.344 mln
-40.98%
jan 1, 2002
9.338 mln
-12.76 mln
-57.74%
jan 1, 2003
16.151 mln
+6.813 mln
72.96%
jan 1, 2004
-434.0K
-16.585 mln
-102.69%
jan 1, 2005
9.803 mln
+10.237 mln
-2.36K%
jan 1, 2006
22.719 mln
+12.916 mln
131.76%
jan 1, 2007
9.778 mln
-12.941 mln
-56.96%
jan 1, 2008
604.0K
-9.174 mln
-93.82%
jan 1, 2009
3.252 mln
+2.648 mln
438.41%
jan 1, 2010
10.424 mln
+7.172 mln
220.54%
jan 1, 2011
-4.763 mln
-15.187 mln
-145.69%
jan 1, 2012
3.349 mln
+8.112 mln
-170.31%
jan 1, 2013
31.582 mln
+28.233 mln
843.03%
jan 1, 2014
40.63 mln
+9.048 mln
28.65%
jan 1, 2015
32.579 mln
-8.051 mln
-19.82%
jan 1, 2016
14.852 mln
-17.727 mln
-54.41%
Ranking of countries by current statistics by years
About & Feedback
Terms
Privacy
FAQ
Support 24/7
Cabinet
Get premium
Donate
The service accepts bank transfer (ACH, Wire) or cards (Visa, MasterCard, etc). Processed by Stripe.
Secured with SSL