33
/
AIzaSyB4mHJ5NPEv-XzF7P6NDYXjlkCWaeKw5bc
November 1, 2025
73323
Australia
AUS
true
2
1
Part time employment, total (% of total employment)
2015,2014,2013,2012,2011,2010,2009,2008,2007,2006,2005,2004,2003,2002
Create a timeline
Public Timelines
For education
For educational institutions
For teachers
For students
Cabinet
For educational institutions
For teachers
For students
Open cabinet
FAQ
Get premium
Close
Create a timeline
Public timelines
FAQ
About & Feedback
Terms
Privacy
FAQ
Support 24/7
Cabinet
Get premium
Donate
Download
Global statistics library
→
Australia
→
Part time employment, total (% of total employment)
This statistics in other country:
Albania
Argentina
Armenia
Aruba
Australia
Austria
Azerbaijan
Bahamas, The
Bahrain
Belgium
Belize
Bhutan
Bolivia
Bosnia and Herzegovina
Botswana
Brazil
British Virgin Islands
Bulgaria
Canada
Caribbean small states
Central Europe and the Baltics
Chile
Colombia
Costa Rica
Croatia
Cyprus
Czech Republic
Denmark
Dominica
Dominican Republic
Ecuador
El Salvador
Estonia
Ethiopia
Euro area
Europe & Central Asia
Europe & Central Asia (IDA & IBRD countries)
European Union
Finland
France
French Polynesia
Georgia
Germany
Greece
Grenada
Guam
Guatemala
High income
Honduras
Hong Kong SAR, China
Hungary
Iceland
Indonesia
Ireland
Israel
Italy
Jamaica
Japan
Korea, Rep.
Kosovo
Latin America & Caribbean
Latin America & Caribbean (excluding high income)
Latin America & the Caribbean (IDA & IBRD countries)
Latvia
Lithuania
Luxembourg
Macao SAR, China
Macedonia, FYR
Madagascar
Malta
Mauritius
Mexico
Moldova
Montenegro
Namibia
Netherlands
New Zealand
Nicaragua
North America
Norway
OECD members
Pakistan
Panama
Paraguay
Peru
Poland
Portugal
Post-demographic dividend
Romania
Russian Federation
Samoa
Slovak Republic
Slovenia
South Africa
Spain
St. Kitts and Nevis
St. Vincent and the Grenadines
Suriname
Sweden
Switzerland
Syrian Arab Republic
Tanzania
Thailand
Tonga
Trinidad and Tobago
Turkey
United Kingdom
United States
Uruguay
Venezuela, RB
Zimbabwe
Timeline:
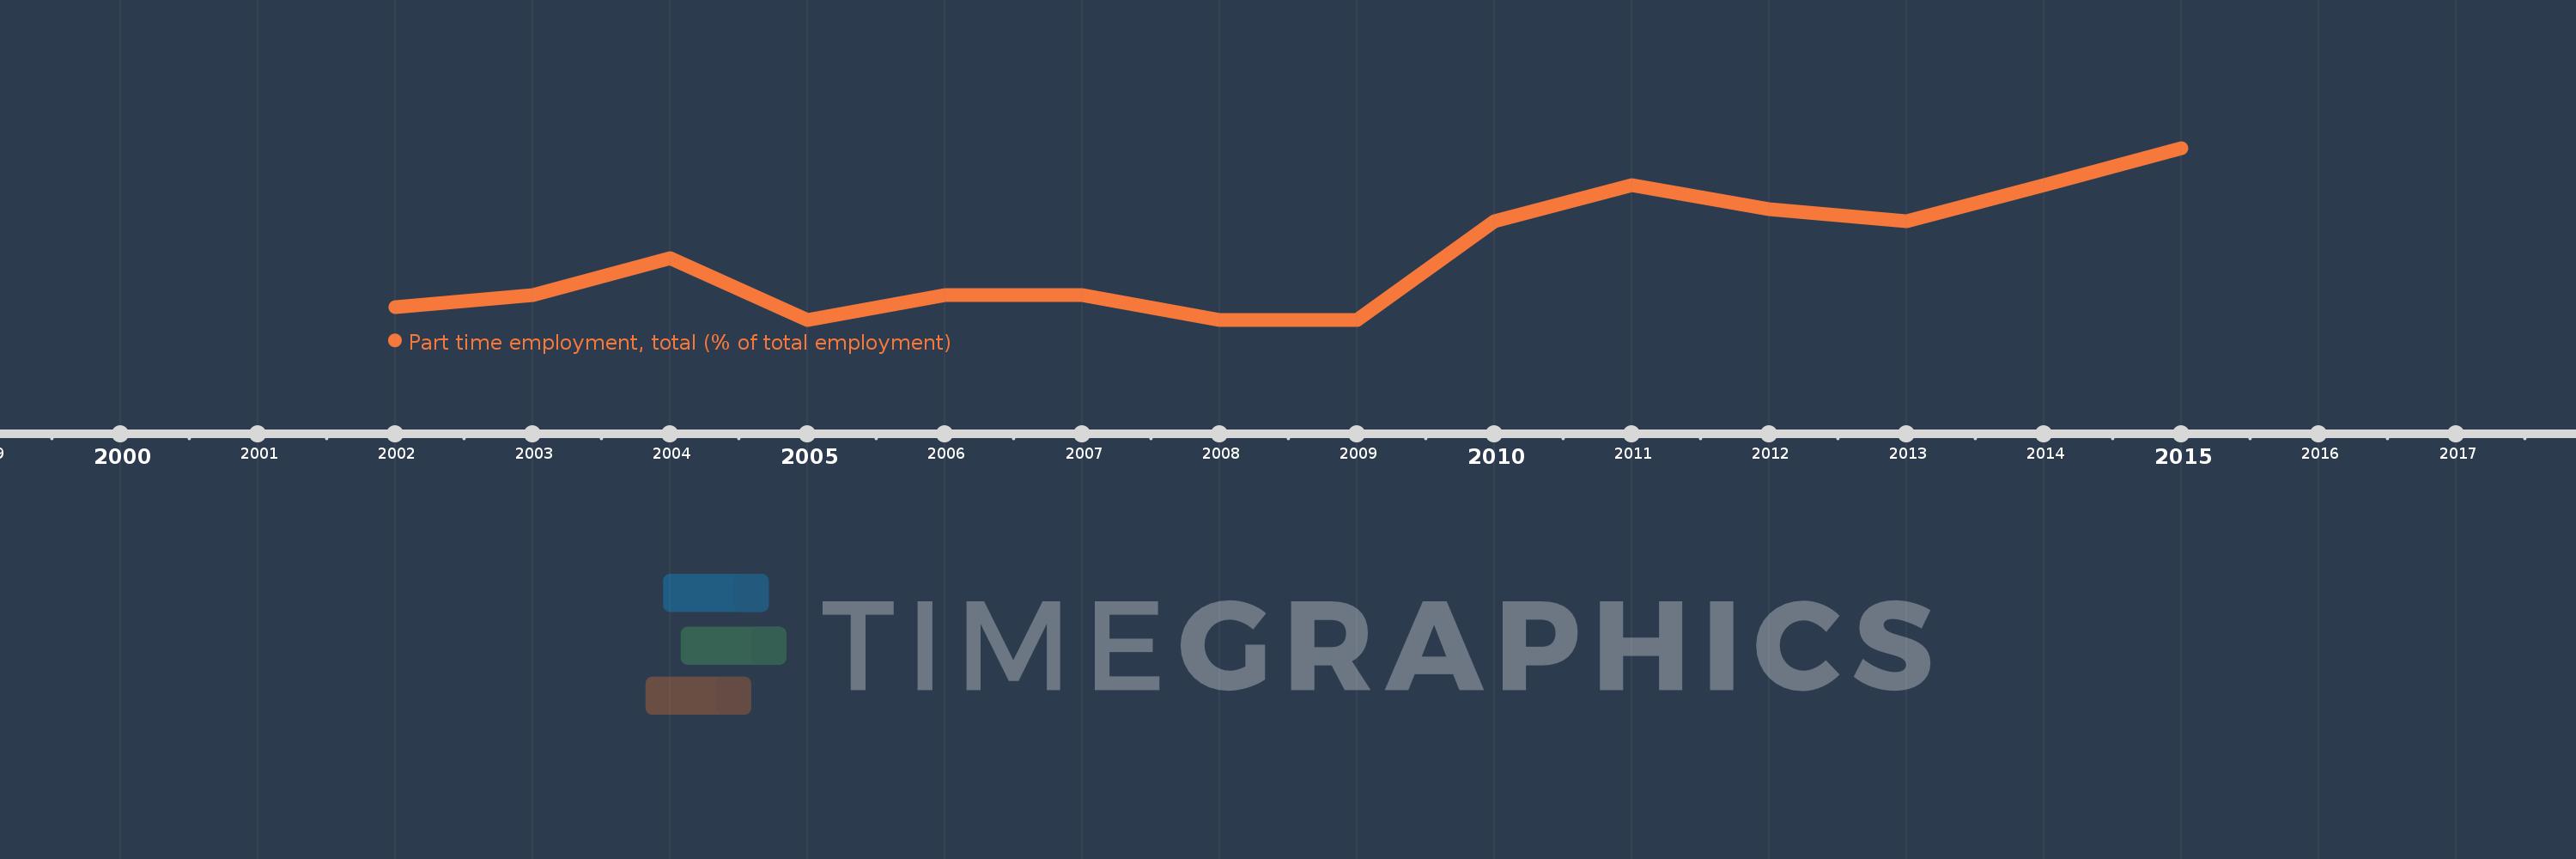
This timeline shows a graph from
2002
to
2015
of Australia. No data until
2001
. Number of actual observations by date:
14
.
Source name:
World Development Indicators
Source organization:
International Labour Organization, Key Indicators of the Labour Market database.
Categories, topics:
Social Protection & Labor
Last updated:
apr 23, 2017
Indicators value changes by year
Meaning:
24.221
Minimum:
23.7
jan 1, 2005
Maximum:
25.1
jan 1, 2015
At the date of observation
Value
Absolute change
Change from the previous value
jan 1, 2002
23.8
+23.8
0.0%
jan 1, 2003
23.9
+0.1
0.42%
jan 1, 2004
24.2
+0.3
1.26%
jan 1, 2005
23.7
-0.5
-2.07%
jan 1, 2006
23.9
+0.2
0.84%
jan 1, 2007
23.9
0.0
0.0%
jan 1, 2008
23.7
-0.2
-0.84%
jan 1, 2009
23.7
0.0
0.0%
jan 1, 2010
24.5
+0.8
3.38%
jan 1, 2011
24.8
+0.3
1.22%
jan 1, 2012
24.6
-0.2
-0.81%
jan 1, 2013
24.5
-0.1
-0.41%
jan 1, 2014
24.8
+0.3
1.22%
jan 1, 2015
25.1
+0.3
1.21%
Ranking of countries by current statistics by years
About & Feedback
Terms
Privacy
FAQ
Support 24/7
Cabinet
Get premium
Donate
The service accepts bank transfer (ACH, Wire) or cards (Visa, MasterCard, etc). Processed by Stripe.
Secured with SSL