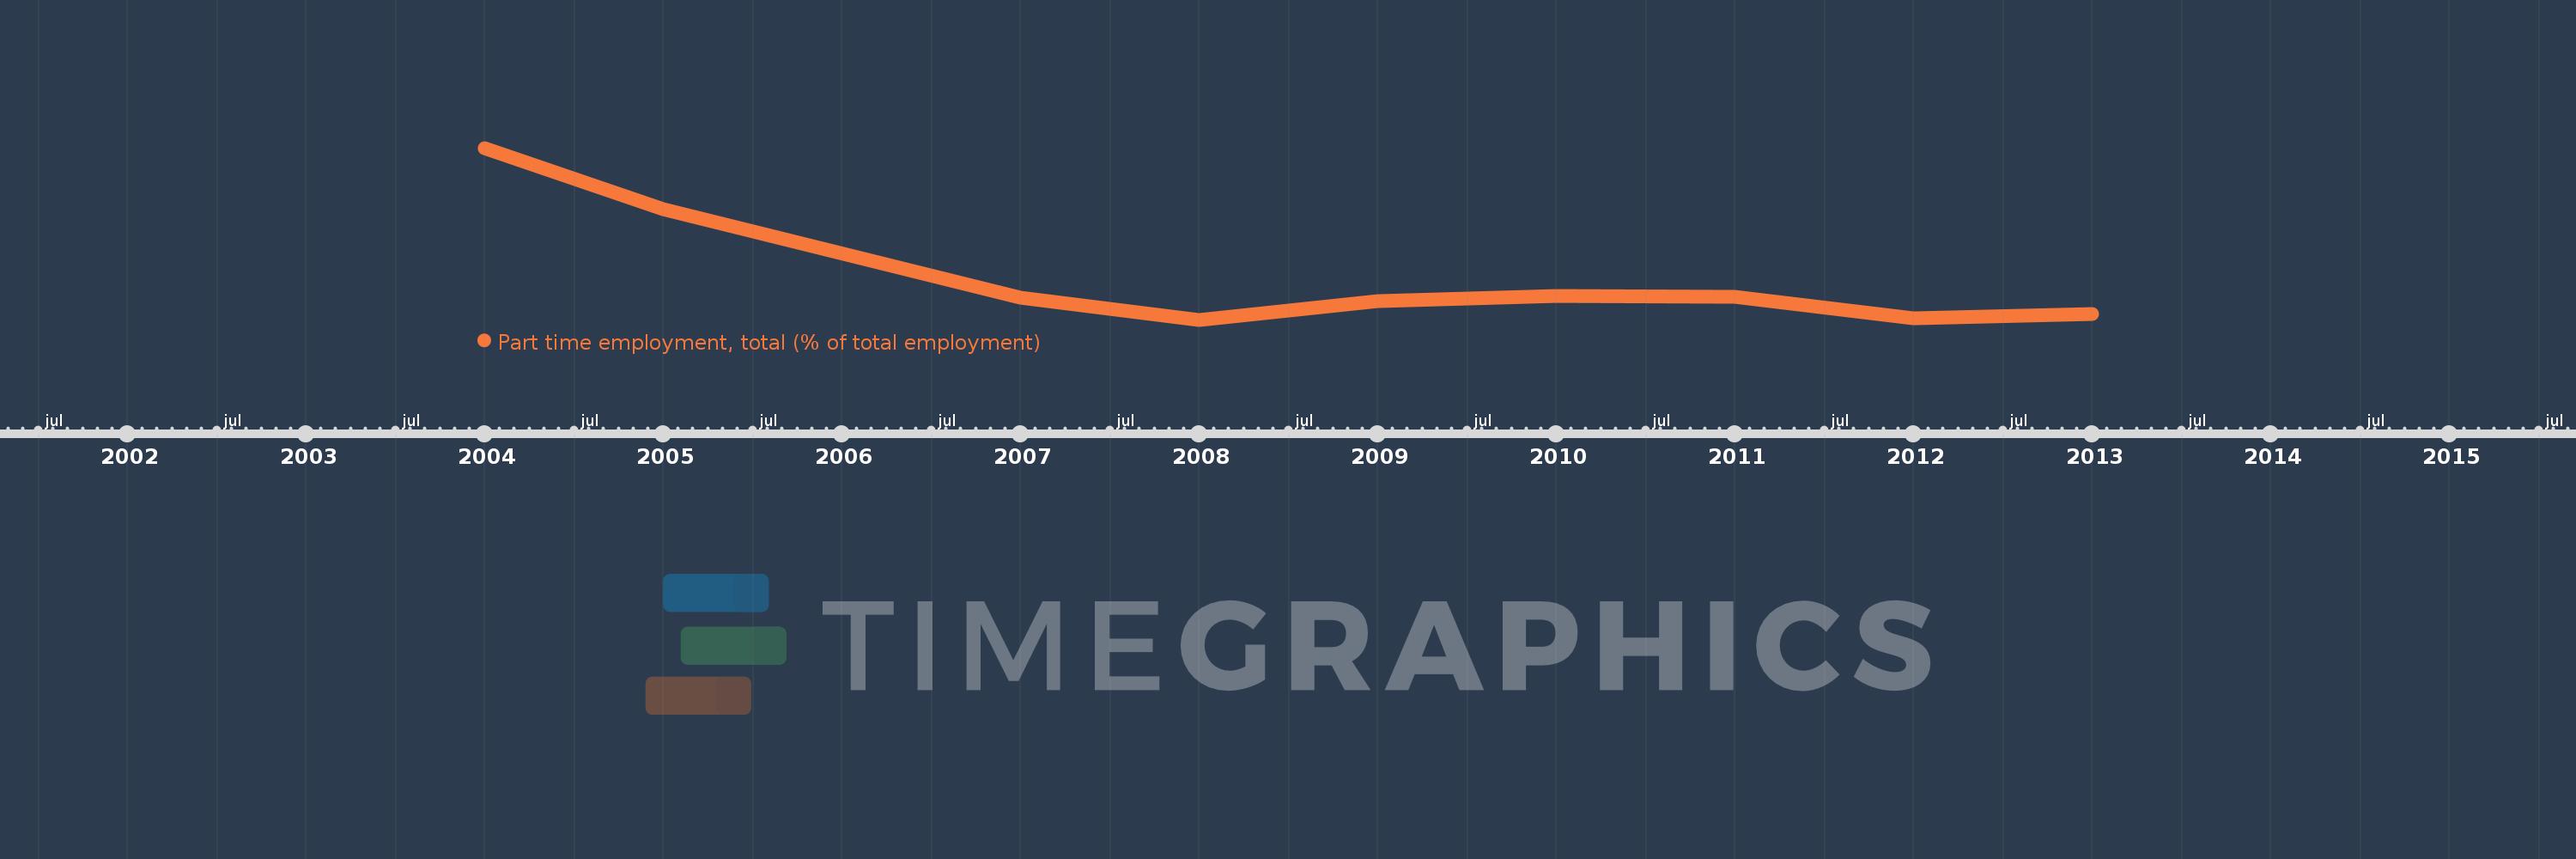
This timeline shows a graph from 2004 to 2013 of Europe & Central Asia (IDA & IBRD countries). No data until 2003. Number of actual observations by date: 9.
Source name:
World Development Indicators
Source organization:
International Labour Organization, Key Indicators of the Labour Market database.
Categories, topics:
Social Protection & Labor
Last updated:
apr 23, 2017
Indicators value changes by year
Meaning:
6.991
Minimum:
6.709
jan 1, 2008
Maximum:
7.867
jan 1, 2004
At the date of observation
Value
Absolute change
Change from the previous value
jan 1, 2004
7.867
+7.867
0.0%
jan 1, 2005
7.453
-0.414
-5.26%
jan 1, 2007
6.857
-0.597
-8.0%
jan 1, 2008
6.709
-0.148
-2.15%
jan 1, 2009
6.835
+0.125
1.87%
jan 1, 2010
6.872
+0.038
0.55%
jan 1, 2011
6.862
-0.01
-0.15%
jan 1, 2012
6.72
-0.142
-2.06%
jan 1, 2013
6.747
+0.027
0.4%
Ranking of countries by current statistics by years