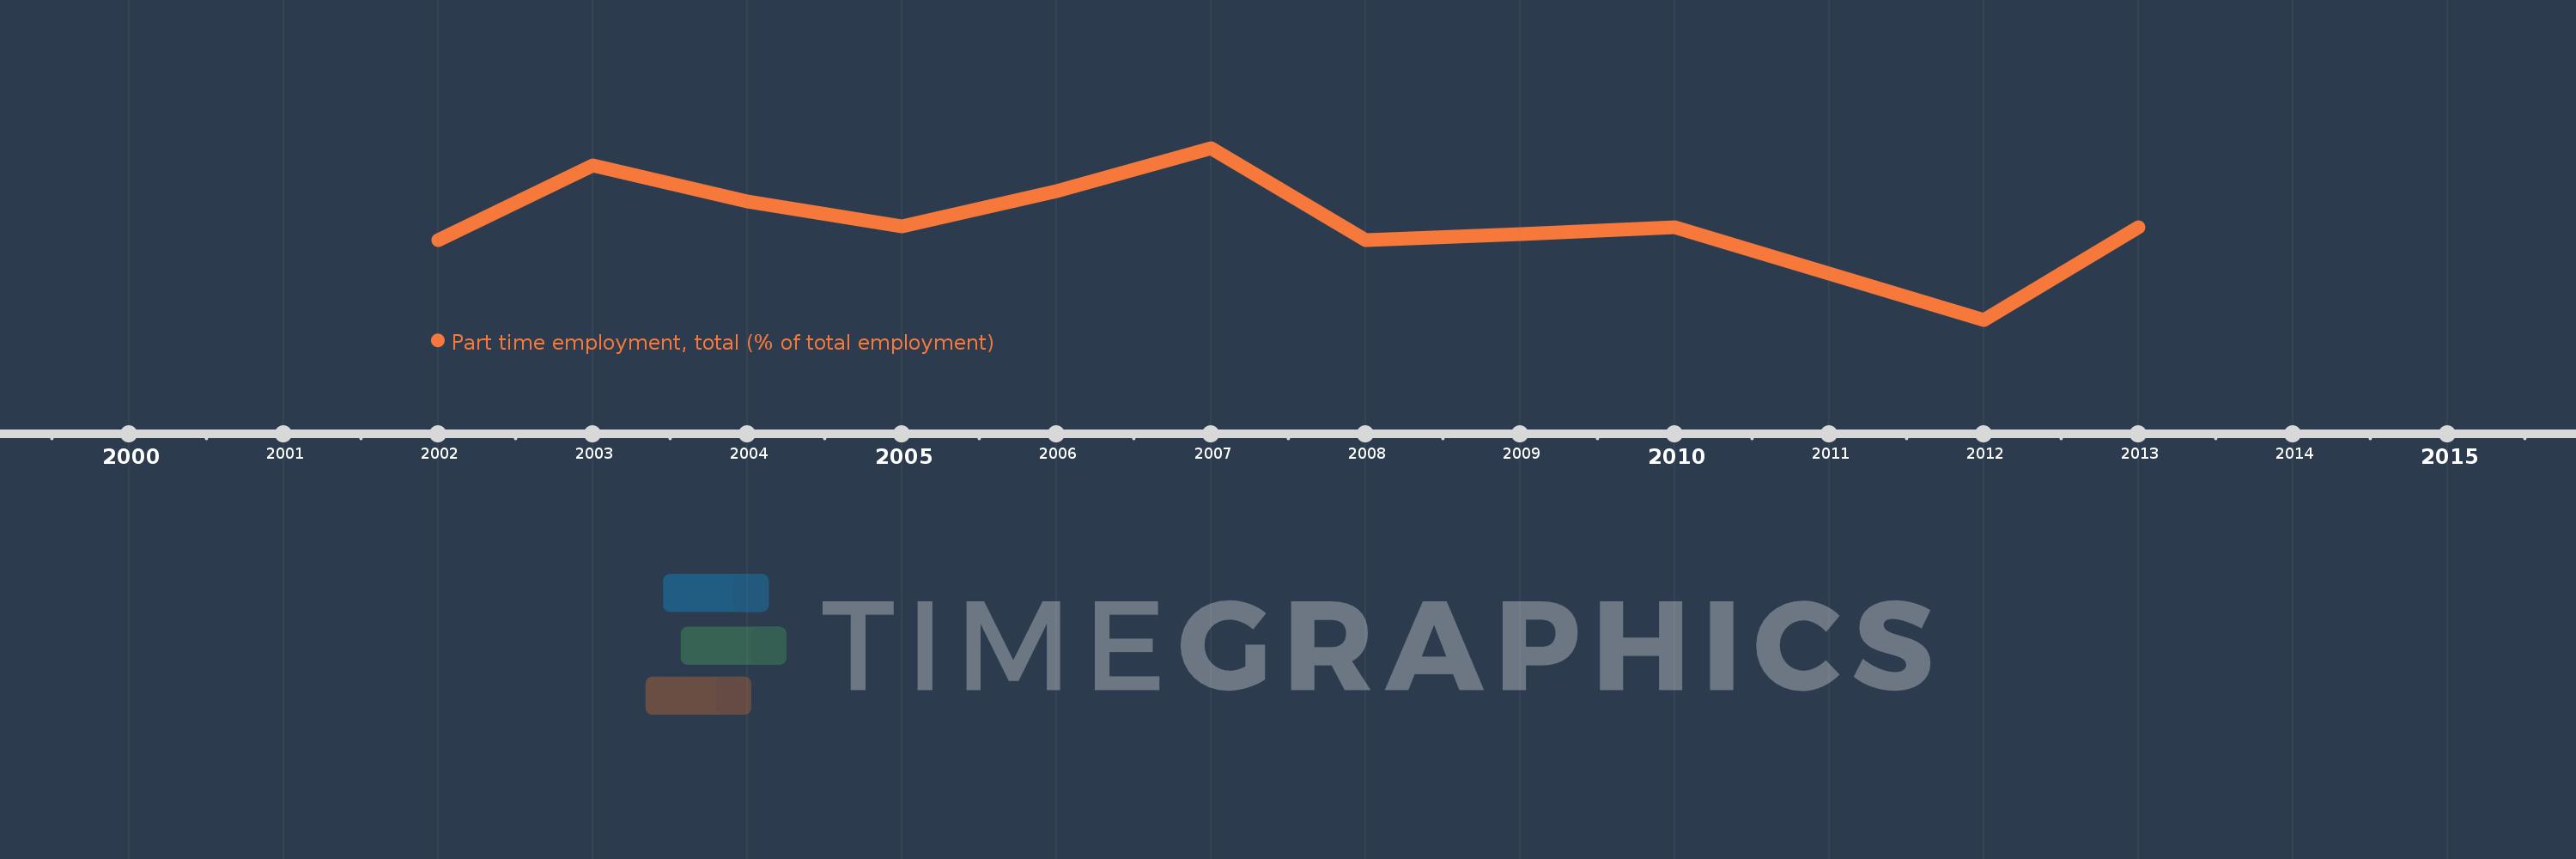
This timeline shows a graph from 2002 to 2013 of Latin America & Caribbean (excluding high income). No data until 2001. Number of actual observations by date: 11.
Source name:
World Development Indicators
Source organization:
International Labour Organization, Key Indicators of the Labour Market database.
Categories, topics:
Social Protection & Labor
Last updated:
apr 23, 2017
Indicators value changes by year
Meaning:
18.033
Minimum:
16.682
jan 1, 2012
Maximum:
19.013
jan 1, 2007
At the date of observation
Value
Absolute change
Change from the previous value
jan 1, 2002
17.757
+17.757
0.0%
jan 1, 2003
18.777
+1.021
5.75%
jan 1, 2004
18.287
-0.49
-2.61%
jan 1, 2005
17.948
-0.339
-1.86%
jan 1, 2006
18.428
+0.48
2.68%
jan 1, 2007
19.013
+0.586
3.18%
jan 1, 2008
17.757
-1.256
-6.61%
jan 1, 2009
17.848
+0.09
0.51%
jan 1, 2010
17.933
+0.085
0.48%
jan 1, 2012
16.682
-1.251
-6.98%
jan 1, 2013
17.933
+1.251
7.5%
Ranking of countries by current statistics by years