33
/
AIzaSyB4mHJ5NPEv-XzF7P6NDYXjlkCWaeKw5bc
November 30, 2025
72454
Aruba
ABW
true
2
1
Percentage of female teachers in secondary education who are trained, female (%)
2013,2012,2011,2010,2007,2006,2005,2004,2003,2002,2001,2000
Create a timeline
Public Timelines
For education
For educational institutions
For teachers
For students
Cabinet
For educational institutions
For teachers
For students
Open cabinet
FAQ
Close
Create a timeline
Public timelines
FAQ
About & Feedback
Terms
Privacy
FAQ
Support 24/7
Cabinet
Get premium
Donate
Download
Global statistics library
→
Aruba
→
Percentage of female teachers in secondary education who are trained, female (%)
This statistics in other country:
Andorra
Antigua and Barbuda
Arab World
Aruba
Bahamas, The
Bahrain
Bangladesh
Barbados
Belarus
Belize
Benin
Bermuda
Bhutan
Botswana
British Virgin Islands
Brunei Darussalam
Burkina Faso
Burundi
Cabo Verde
Cambodia
Cameroon
Caribbean small states
Cayman Islands
Colombia
Congo, Dem. Rep.
Congo, Rep.
Costa Rica
Cote d'Ivoire
Croatia
Cuba
Djibouti
Dominica
Dominican Republic
Ecuador
Egypt, Arab Rep.
El Salvador
Equatorial Guinea
Eritrea
Ethiopia
Fiji
Fragile and conflict affected situations
Gambia, The
Georgia
Ghana
Gibraltar
Grenada
Guinea
Guyana
Heavily indebted poor countries (HIPC)
Honduras
Hong Kong SAR, China
IDA blend
IDA only
IDA total
Iran, Islamic Rep.
Iraq
Jamaica
Kazakhstan
Kenya
Kiribati
Kuwait
Kyrgyz Republic
Lao PDR
Least developed countries: UN classification
Lebanon
Lesotho
Liberia
Low income
Macao SAR, China
Madagascar
Malawi
Malaysia
Maldives
Mali
Mauritania
Middle East & North Africa
Middle East & North Africa (excluding high income)
Middle East & North Africa (IDA & IBRD countries)
Mongolia
Mozambique
Myanmar
Nauru
Nepal
Nicaragua
Niger
Nigeria
Oman
Other small states
Pacific island small states
Panama
Papua New Guinea
Paraguay
Peru
Philippines
Pre-demographic dividend
Qatar
Rwanda
Sao Tome and Principe
Saudi Arabia
Serbia
Seychelles
Sierra Leone
Singapore
Small states
Solomon Islands
St. Kitts and Nevis
St. Lucia
St. Vincent and the Grenadines
Sub-Saharan Africa
Sub-Saharan Africa (excluding high income)
Sub-Saharan Africa (IDA & IBRD countries)
Sudan
Suriname
Swaziland
Tonga
Turks and Caicos Islands
Uganda
United Arab Emirates
Uzbekistan
West Bank and Gaza
Zimbabwe
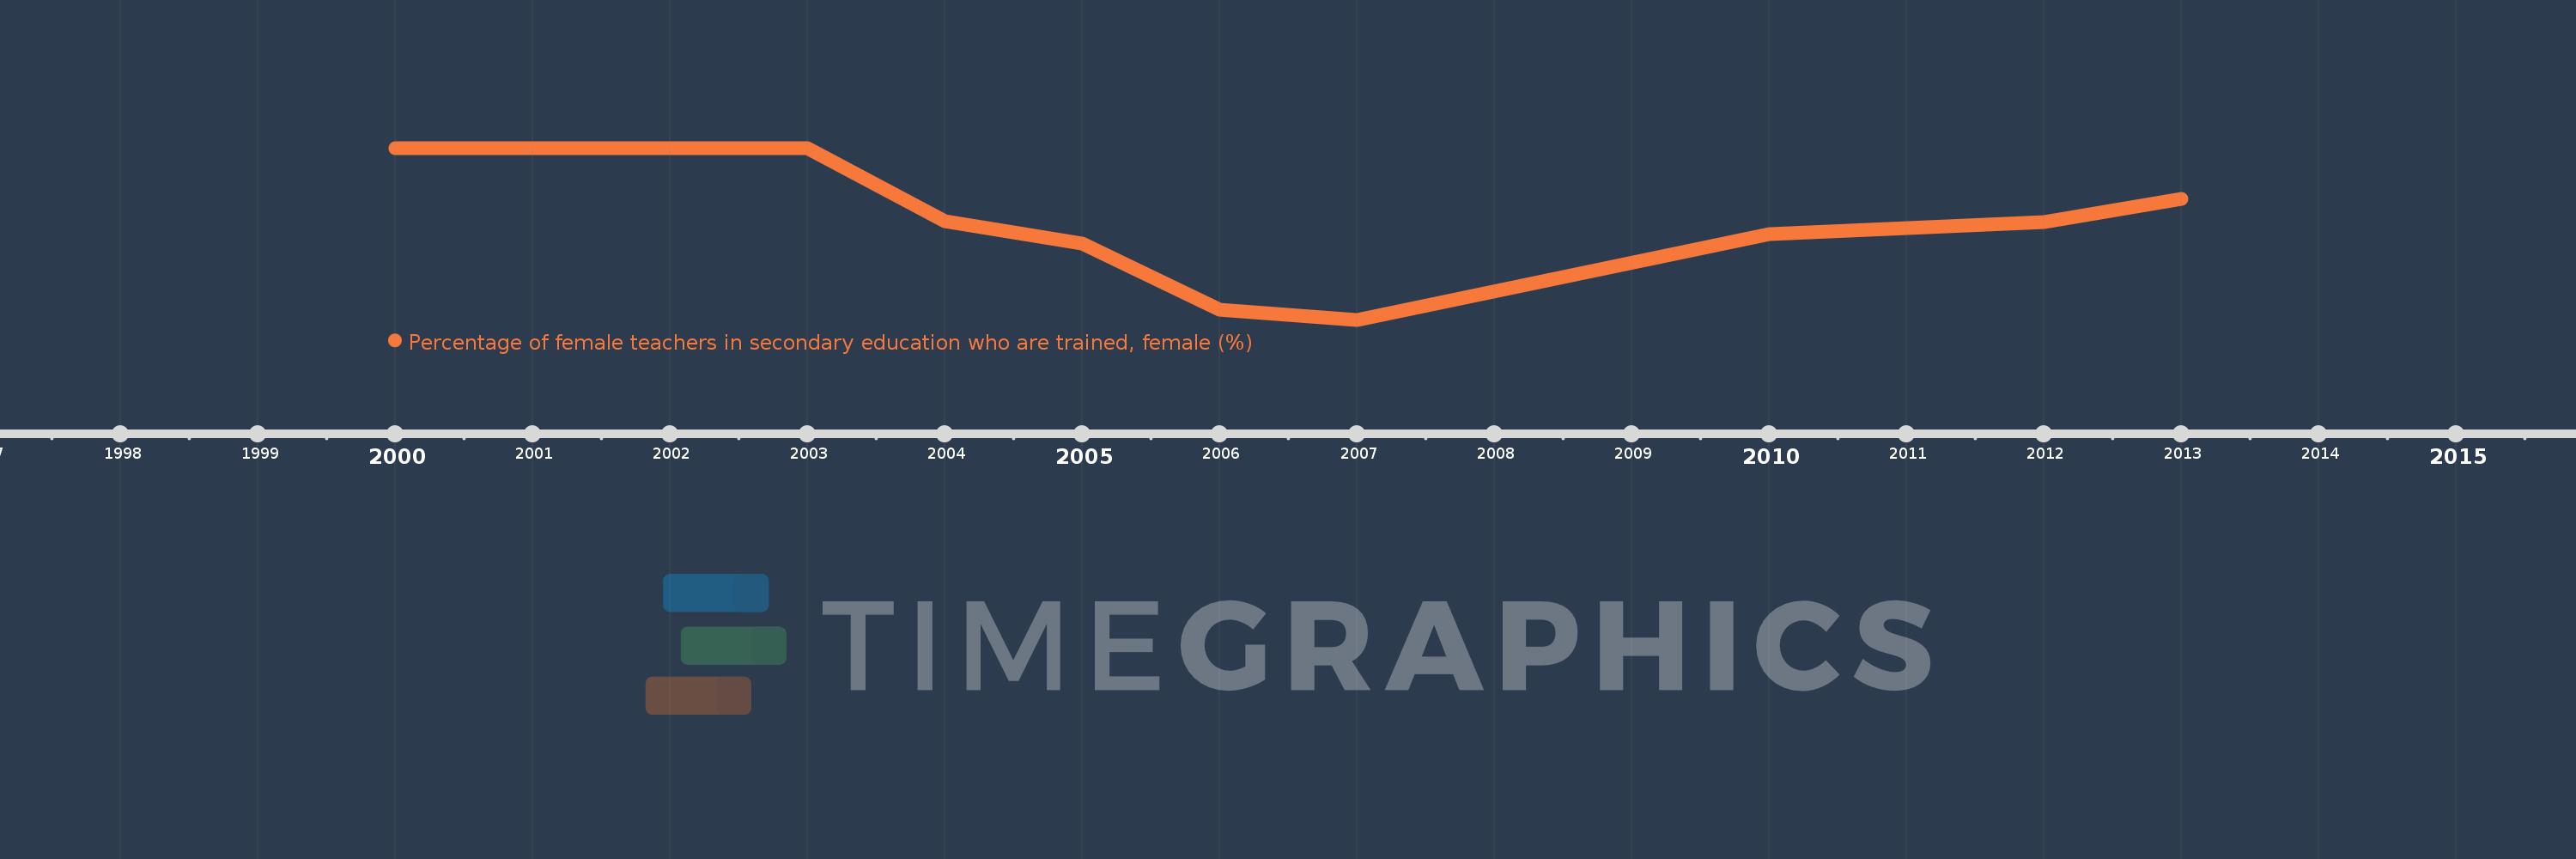
Timeline:
This timeline shows a graph from
2000
to
2013
of Aruba. No data until
1999
. Number of actual observations by date:
12
.
Source name:
World Development Indicators
Source organization:
UNESCO Institute for Statistics
Categories, topics:
Education
Last updated:
apr 23, 2017
Indicators value changes by year
Meaning:
96.858
Minimum:
91.844
jan 1, 2007
Maximum:
100.0
jan 1, 2000
At the date of observation
Value
Absolute change
Change from the previous value
jan 1, 2000
100.0
+100.0
0.0%
jan 1, 2001
100.0
0.0
0.0%
jan 1, 2002
100.0
0.0
0.0%
jan 1, 2003
100.0
0.0
0.0%
jan 1, 2004
96.522
-3.478
-3.48%
jan 1, 2005
95.473
-1.048
-1.09%
jan 1, 2006
92.308
-3.166
-3.32%
jan 1, 2007
91.844
-0.464
-0.5%
jan 1, 2010
95.899
+4.055
4.42%
jan 1, 2011
96.19
+0.291
0.3%
jan 1, 2012
96.497
+0.306
0.32%
jan 1, 2013
97.568
+1.072
1.11%
Ranking of countries by current statistics by years
About & Feedback
Terms
Privacy
FAQ
Support 24/7
Cabinet
Get premium
Donate
The service accepts bank transfer (ACH, Wire) or cards (Visa, MasterCard, etc). Processed by Stripe.
Secured with SSL