Download This statistics in other country:
Timeline:
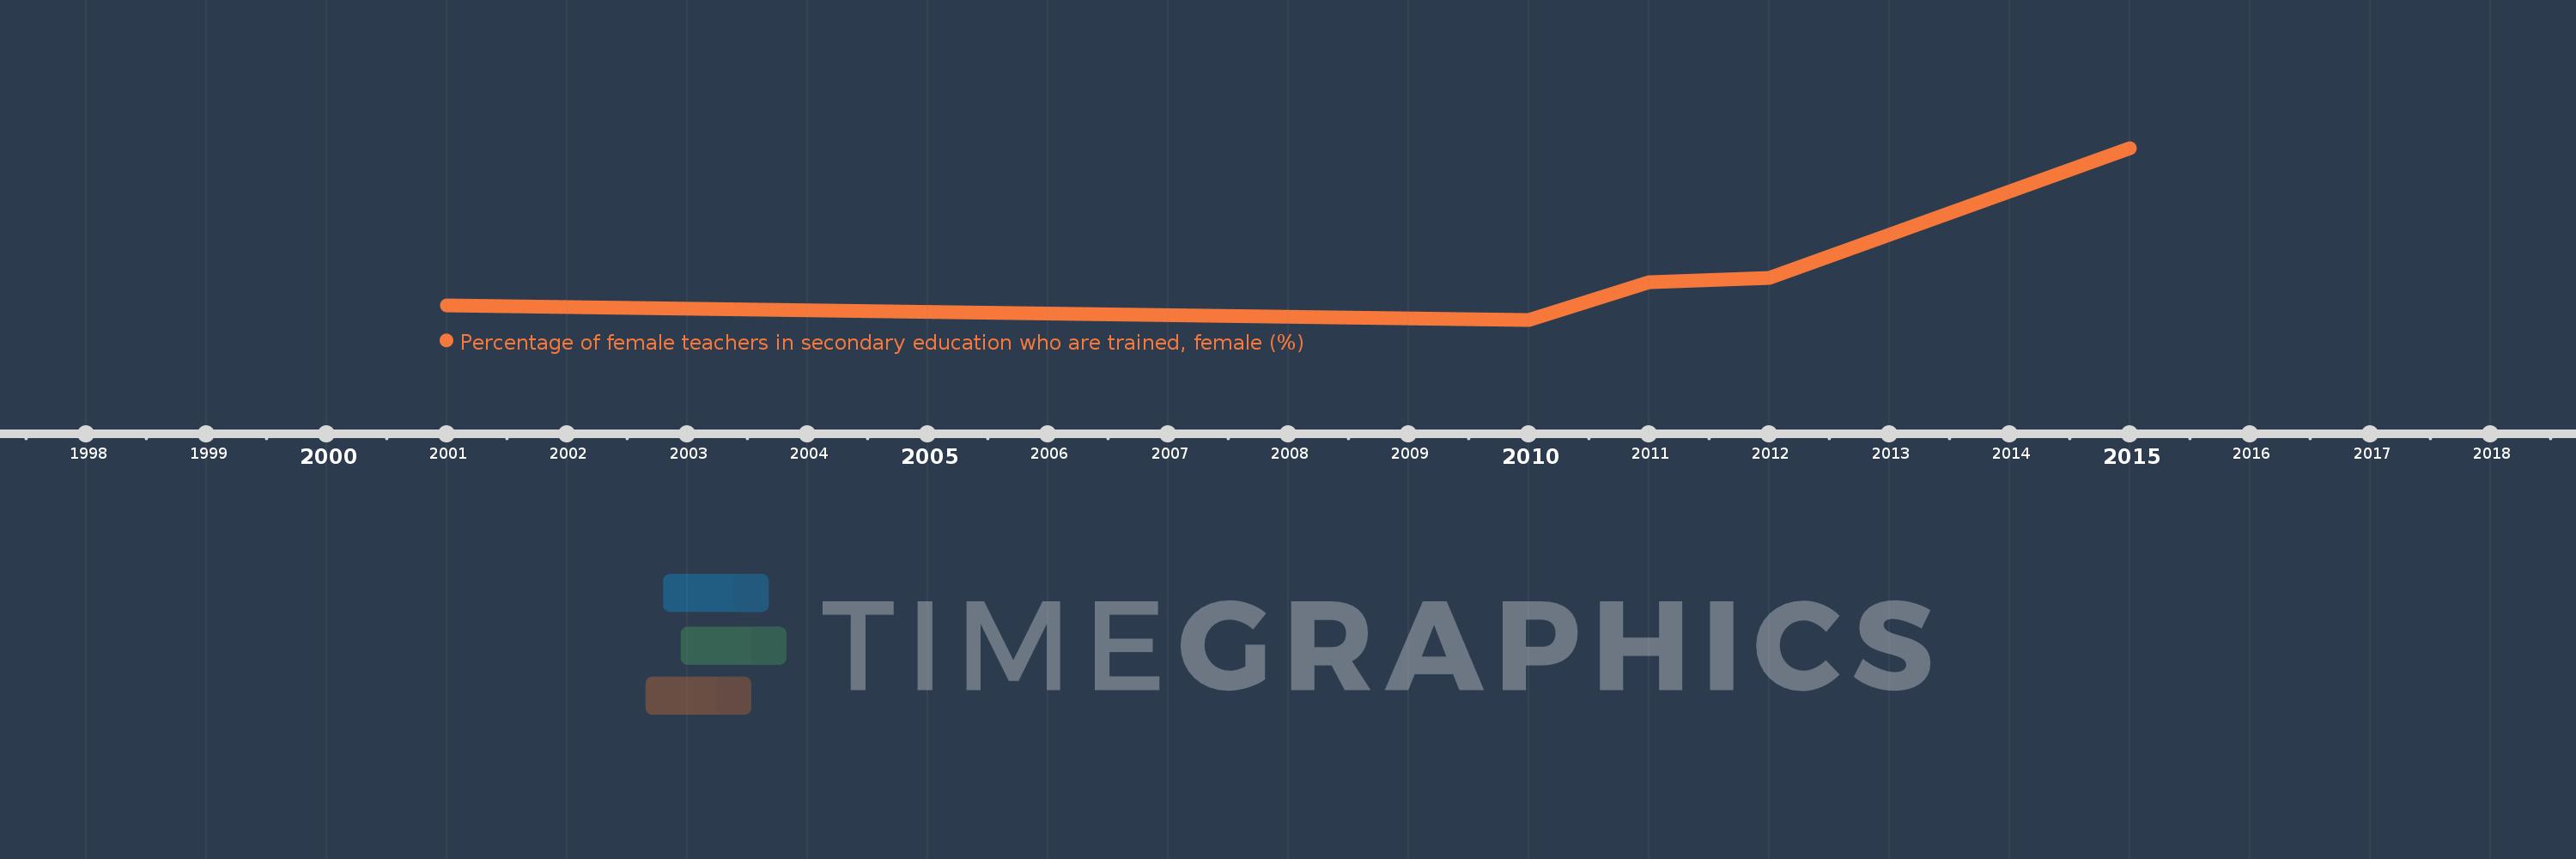
This timeline shows a graph from 2001 to 2015 of Antigua and Barbuda. No data until 2000. Number of actual observations by date: 5.
Source name:
World Development Indicators
Source organization:
UNESCO Institute for Statistics
Categories, topics:
Education
Last updated:
apr 23, 2017
Indicators value changes by year
Minimum:
40.645
jan 1, 2010
Maximum:
53.265
jan 1, 2015
At the date of observation
Value
Absolute change
Change from the previous value
jan 1, 2001
41.727
+41.727
0.0%
jan 1, 2010
40.645
-1.081
-2.59%
jan 1, 2011
43.373
+2.728
6.71%
jan 1, 2012
43.713
+0.339
0.78%
jan 1, 2015
53.265
+9.553
21.85%
Ranking of countries by current statistics by years