Download This statistics in other country:
Timeline:
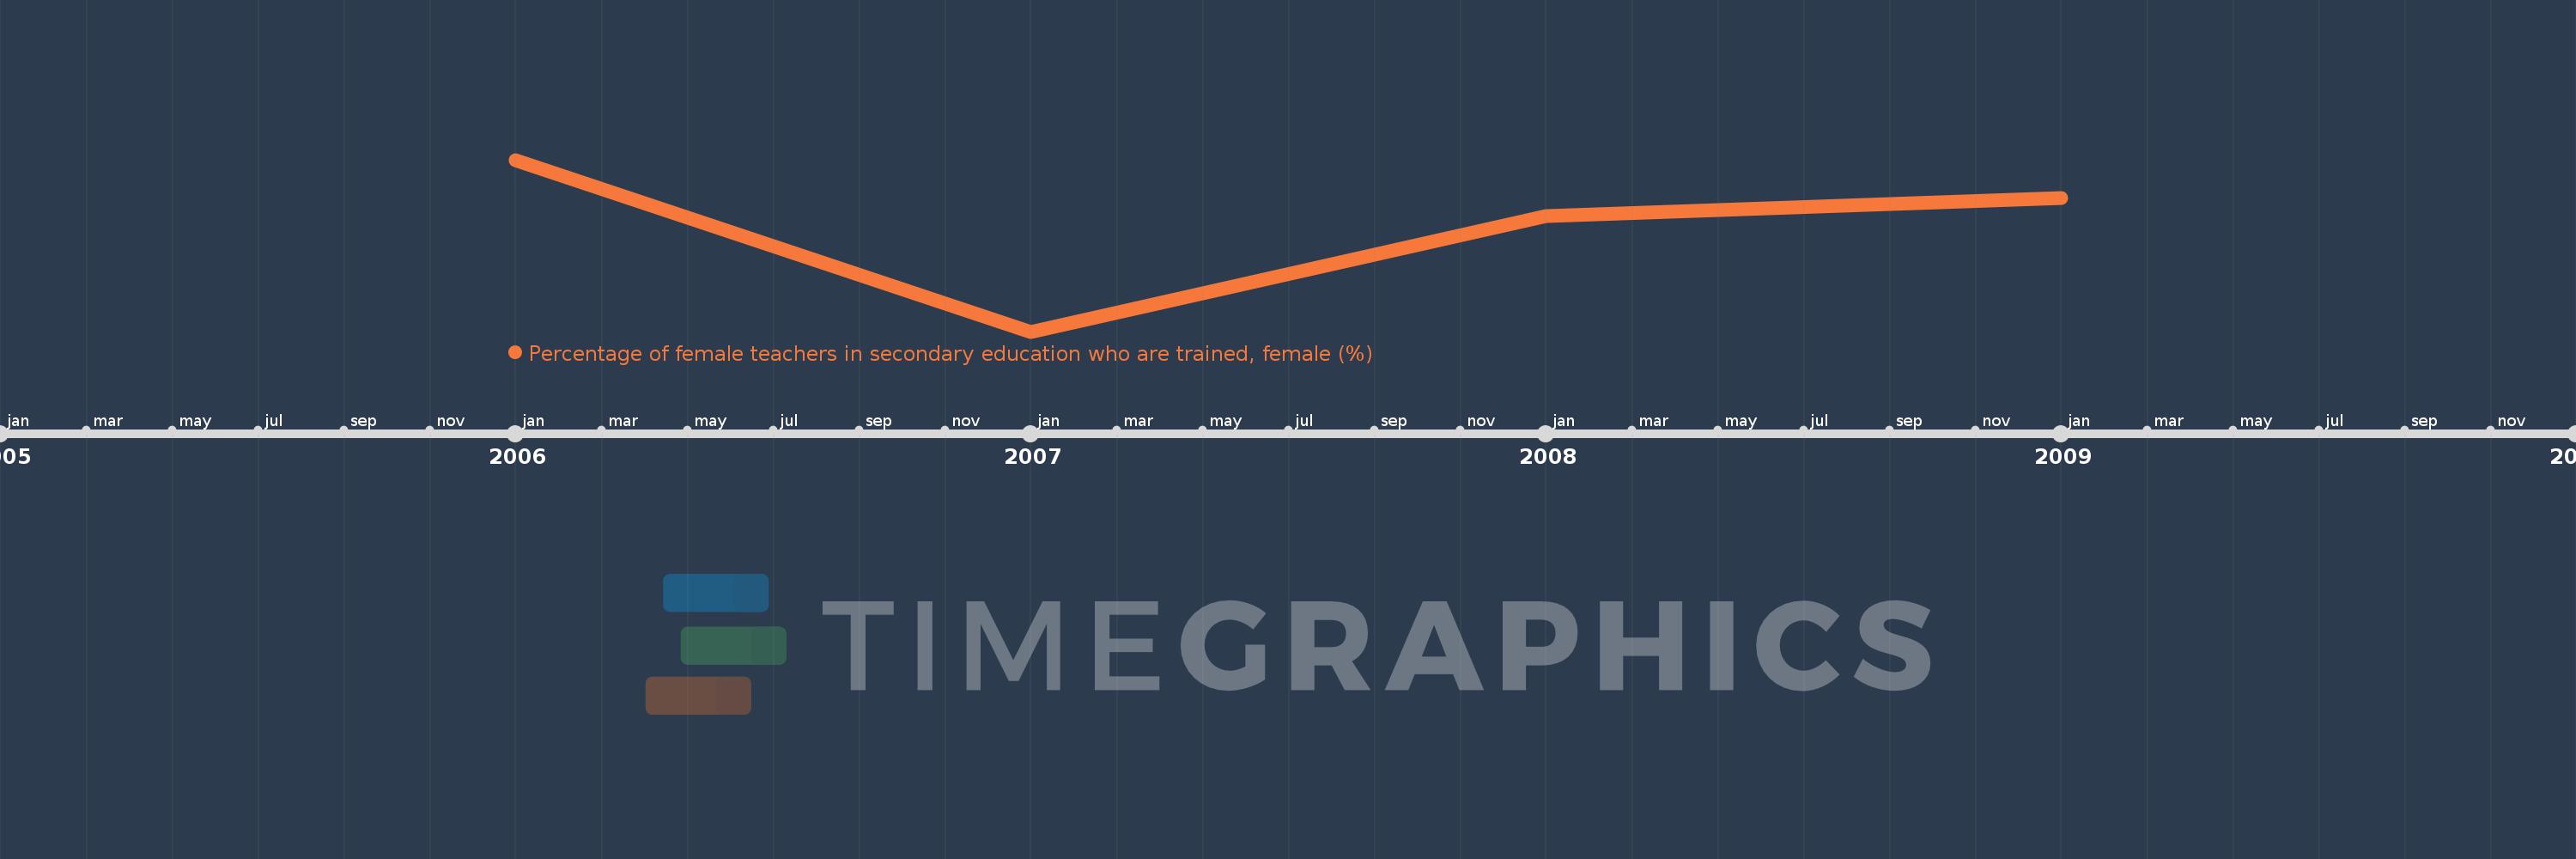
This timeline shows a graph from 2006 to 2009 of Kiribati. No data until 2005. Number of actual observations by date: 4.
Source name:
World Development Indicators
Source organization:
UNESCO Institute for Statistics
Categories, topics:
Education
Last updated:
apr 23, 2017
Indicators value changes by year
Minimum:
50.654
jan 1, 2007
Maximum:
68.634
jan 1, 2006
At the date of observation
Value
Absolute change
Change from the previous value
jan 1, 2006
68.634
+68.634
0.0%
jan 1, 2007
50.654
-17.98
-26.2%
jan 1, 2008
62.733
+12.079
23.85%
jan 1, 2009
64.669
+1.936
3.09%
Ranking of countries by current statistics by years