Download This statistics in other country:
Timeline:
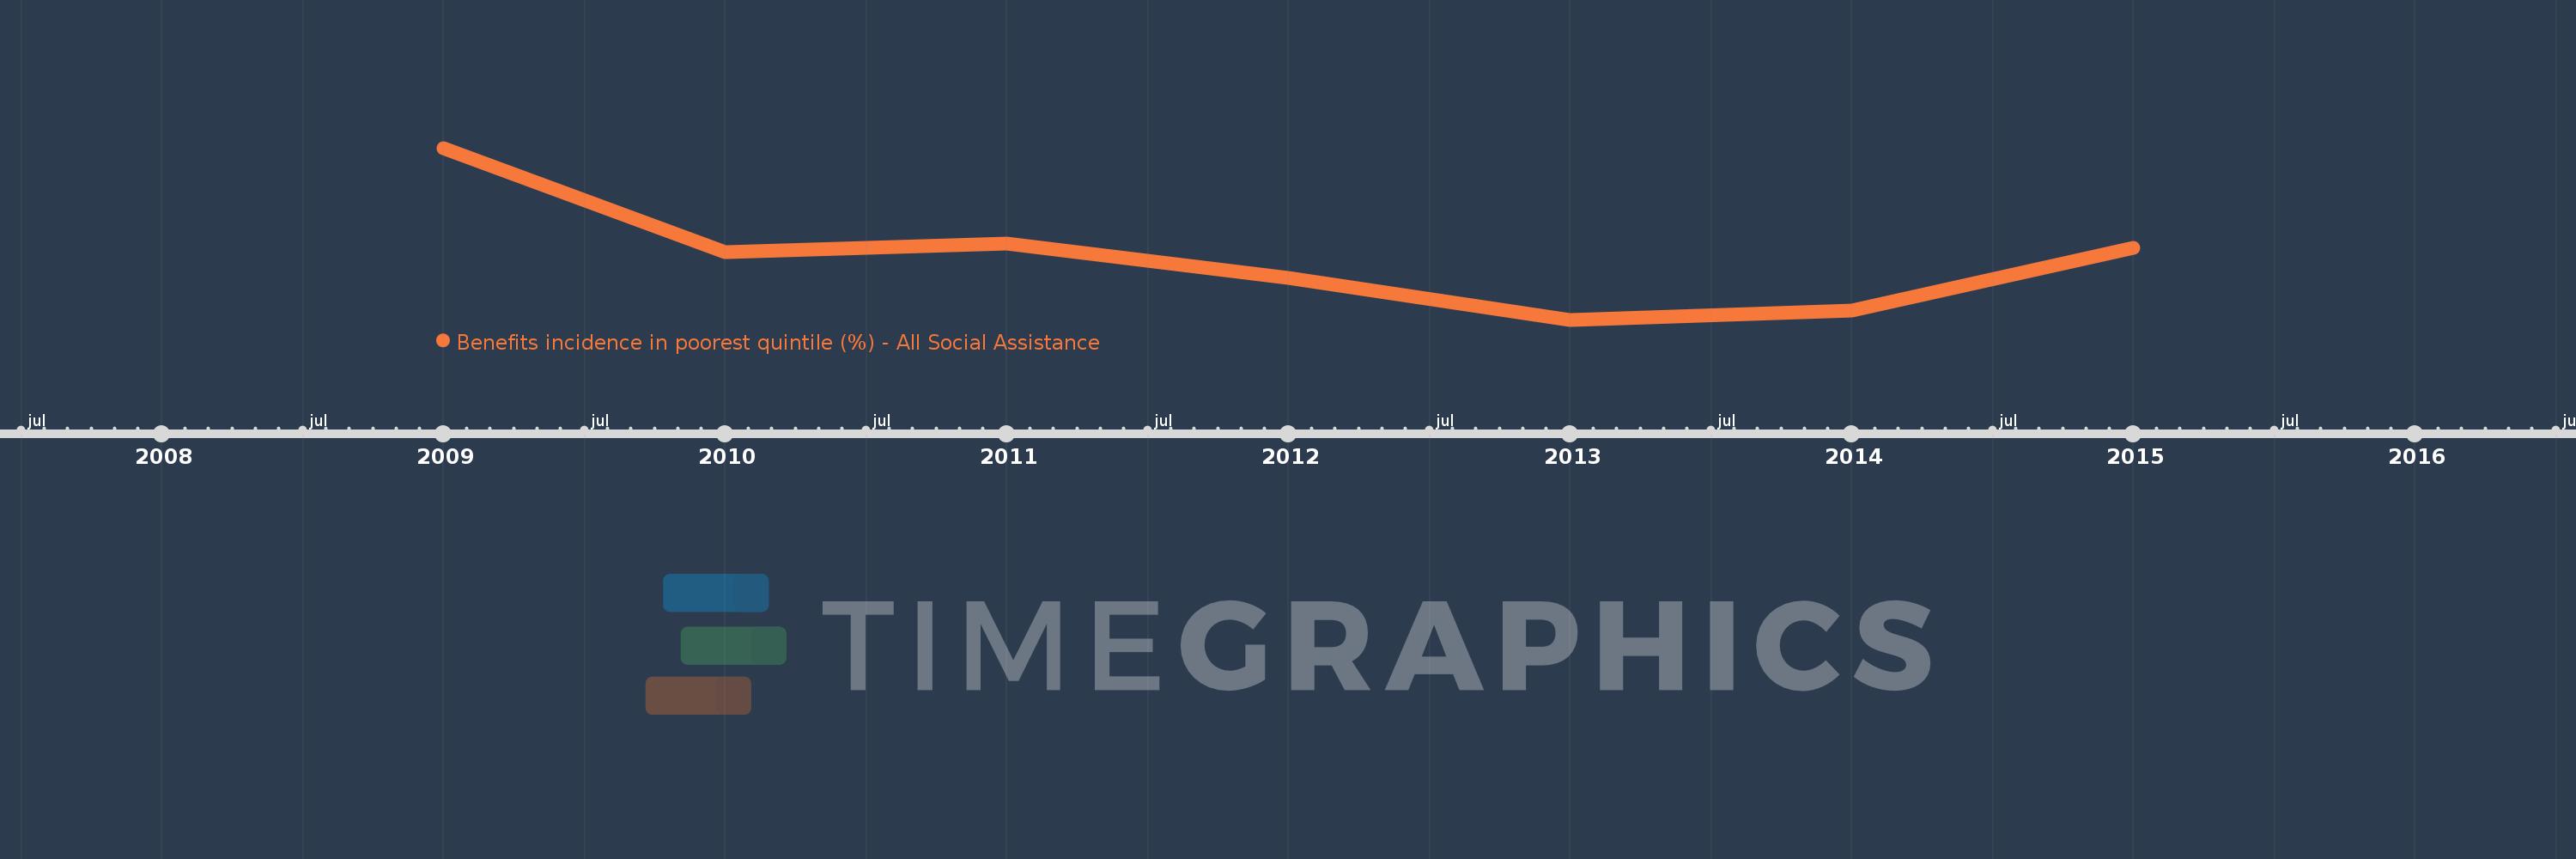
This timeline shows a graph from 2009 to 2015 of Armenia. No data until 2008. Number of actual observations by date: 7.
Source name:
World Development Indicators
Source organization:
The Atlas of Social Protection: Indicators of Resilience and Equity (ASPIRE)
Categories, topics:
Social Protection & Labor
Last updated:
apr 23, 2017
Indicators value changes by year
Minimum:
31.129
jan 1, 2013
Maximum:
34.051
jan 1, 2009
At the date of observation
Value
Absolute change
Change from the previous value
jan 1, 2009
34.051
+34.051
0.0%
jan 1, 2010
32.279
-1.772
-5.2%
jan 1, 2011
32.427
+0.148
0.46%
jan 1, 2012
31.834
-0.593
-1.83%
jan 1, 2013
31.129
-0.705
-2.21%
jan 1, 2014
31.28
+0.151
0.49%
jan 1, 2015
32.346
+1.066
3.41%
Ranking of countries by current statistics by years