Download This statistics in other country:
Timeline:
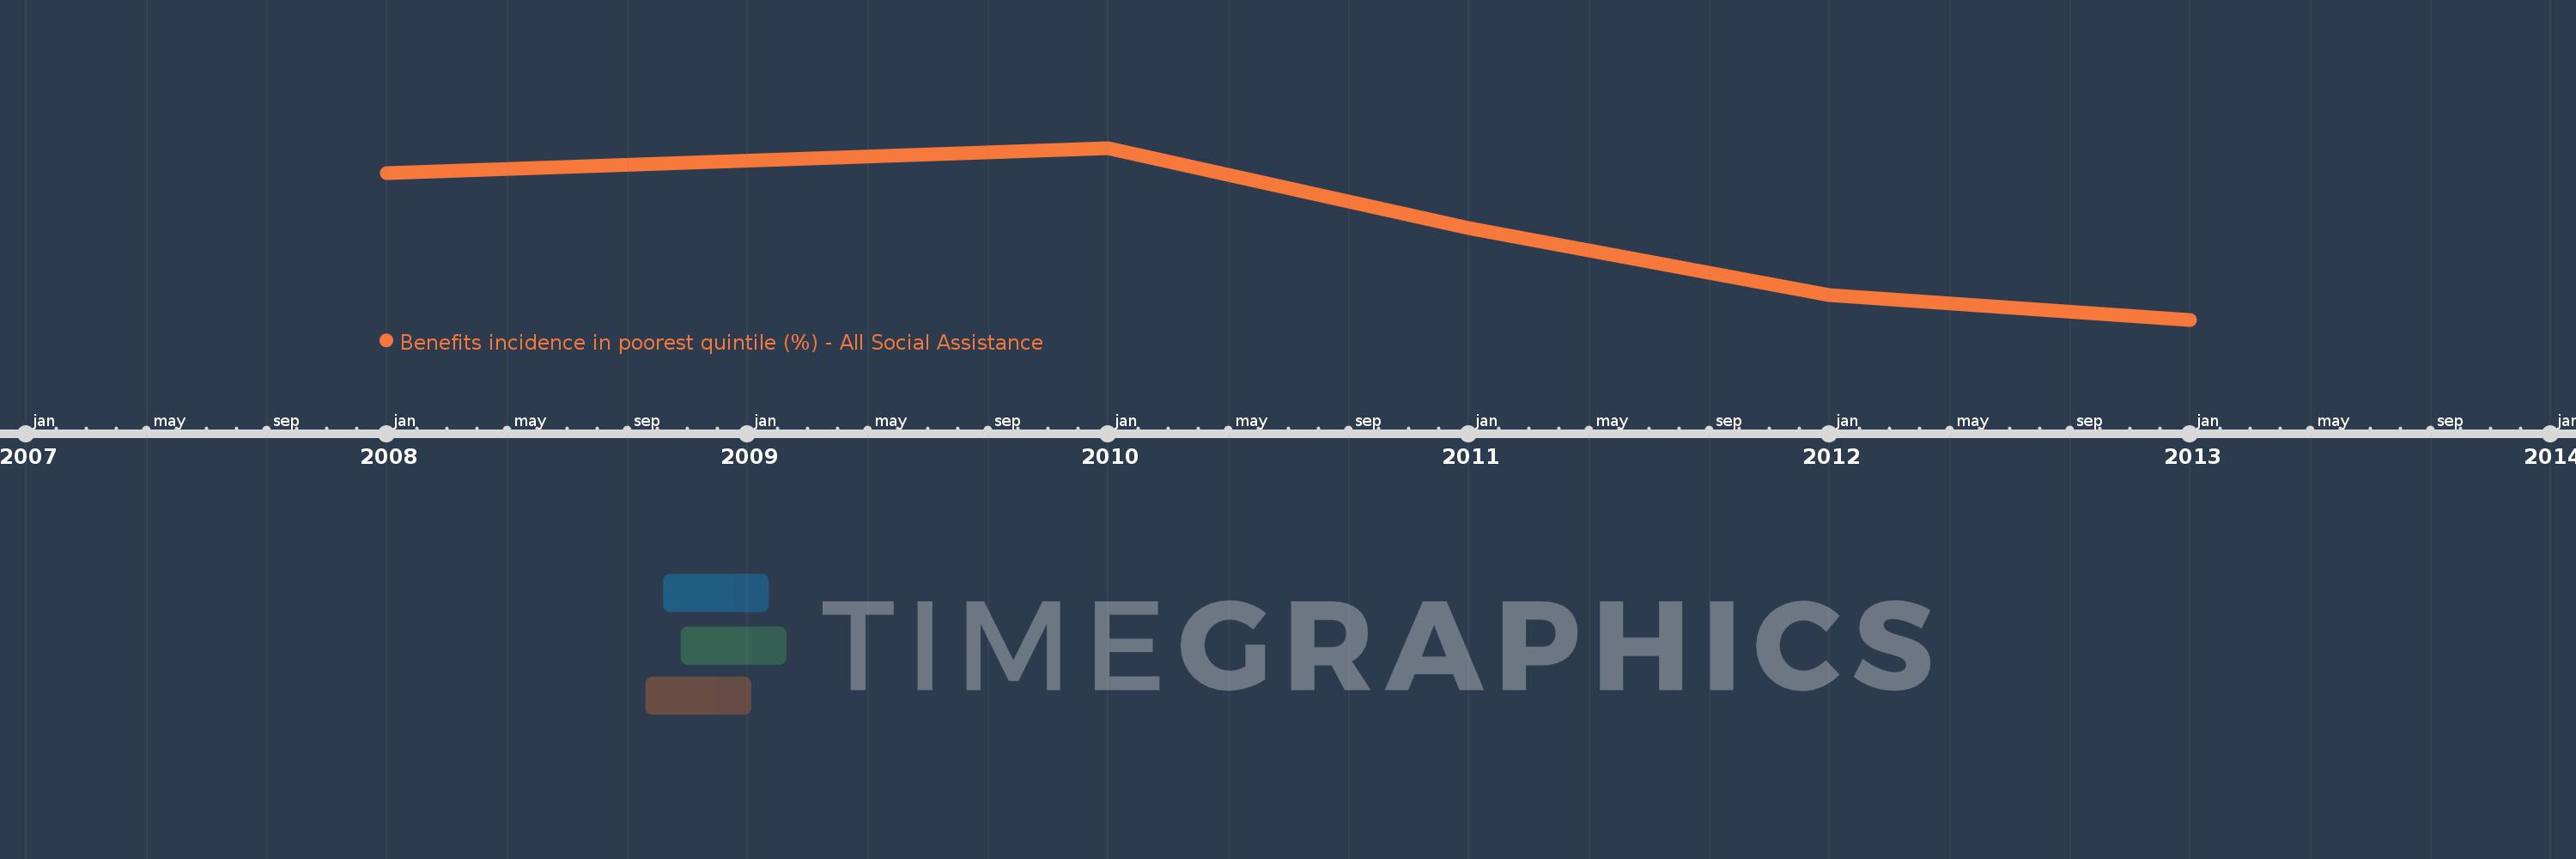
This timeline shows a graph from 2008 to 2013 of Mongolia. No data until 2007. Number of actual observations by date: 5.
Source name:
World Development Indicators
Source organization:
The Atlas of Social Protection: Indicators of Resilience and Equity (ASPIRE)
Categories, topics:
Social Protection & Labor
Last updated:
apr 23, 2017
Indicators value changes by year
Minimum:
18.138
jan 1, 2013
Maximum:
23.367
jan 1, 2010
At the date of observation
Value
Absolute change
Change from the previous value
jan 1, 2008
22.601
+22.601
0.0%
jan 1, 2010
23.367
+0.765
3.39%
jan 1, 2011
20.922
-2.445
-10.46%
jan 1, 2012
18.878
-2.044
-9.77%
jan 1, 2013
18.138
-0.74
-3.92%
Ranking of countries by current statistics by years