Download This statistics in other country:
Timeline:
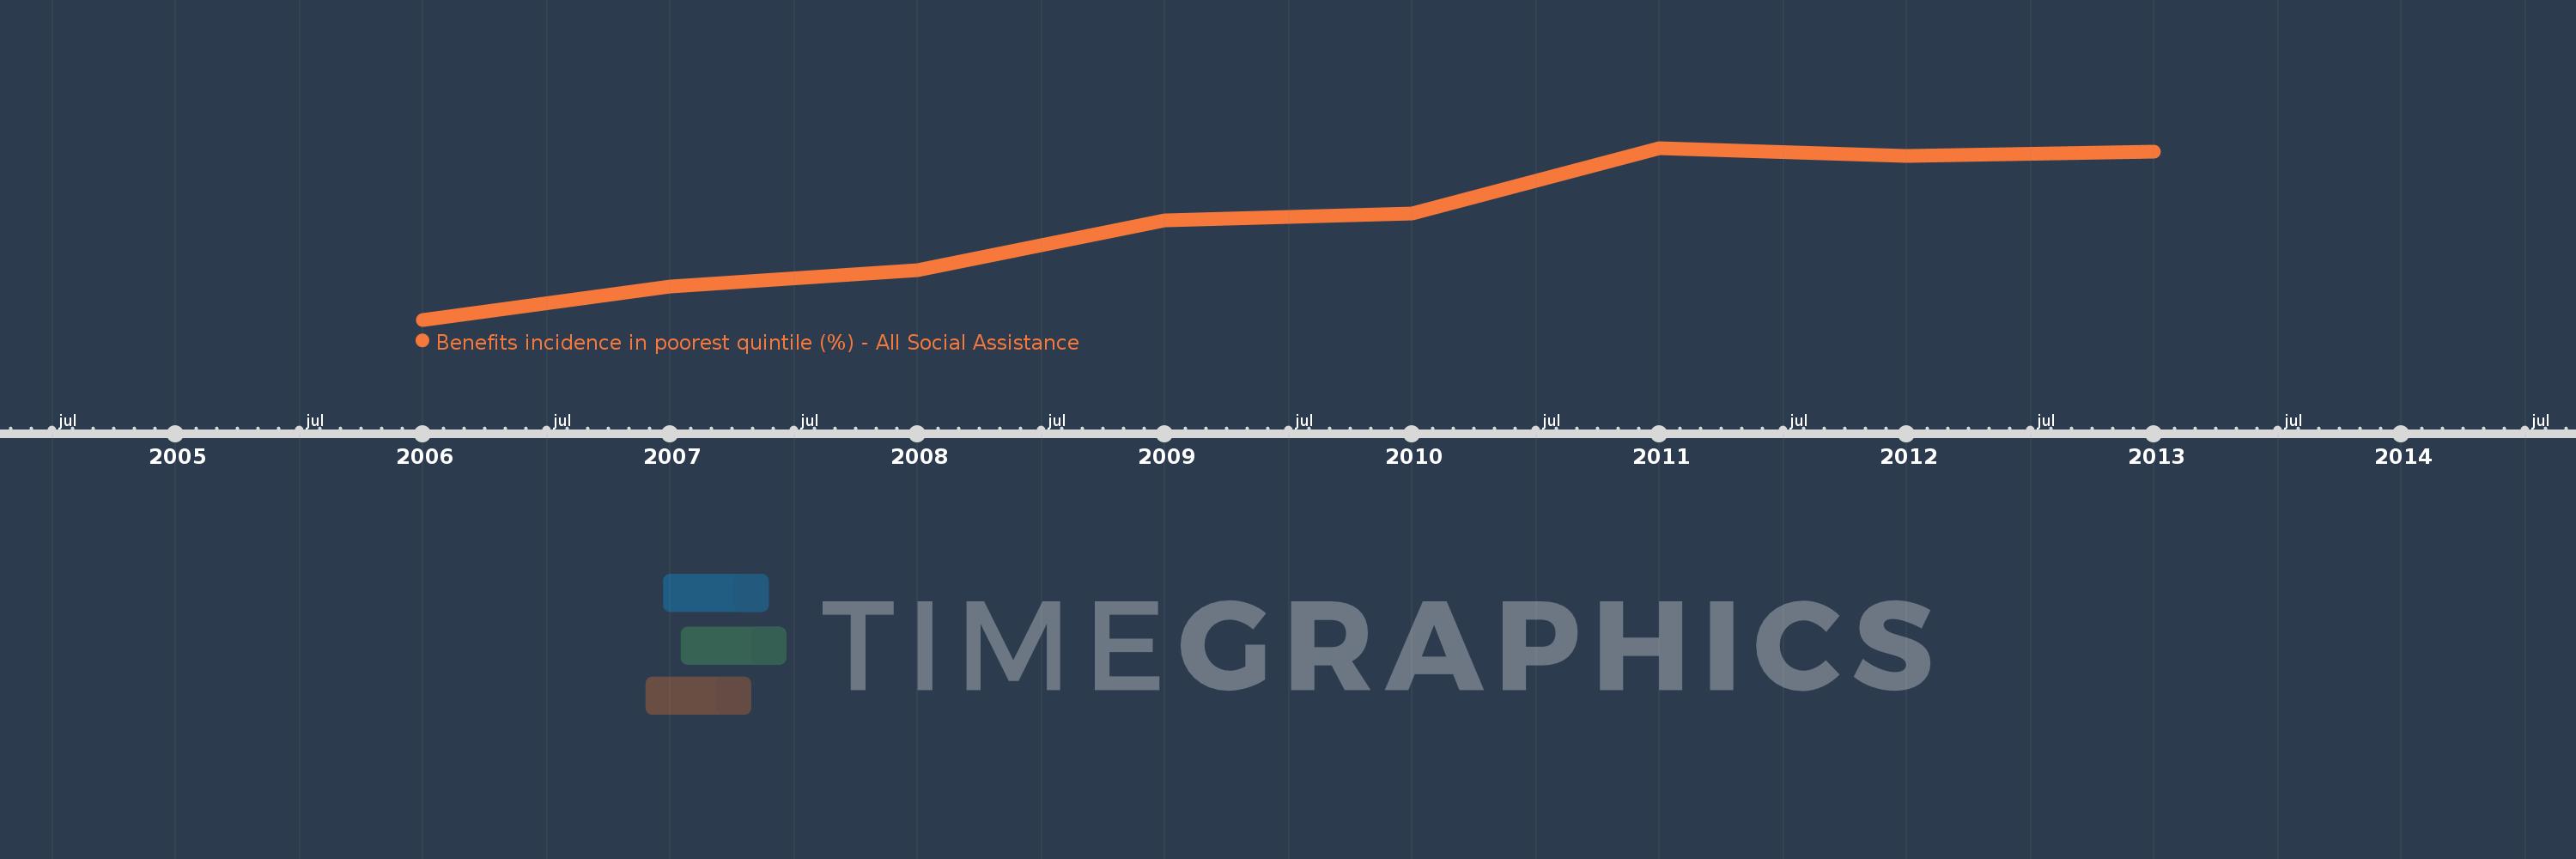
This timeline shows a graph from 2006 to 2013 of Poland. No data until 2005. Number of actual observations by date: 8.
Source name:
World Development Indicators
Source organization:
The Atlas of Social Protection: Indicators of Resilience and Equity (ASPIRE)
Categories, topics:
Social Protection & Labor
Last updated:
apr 23, 2017
Indicators value changes by year
At the date of observation
Value
Absolute change
Change from the previous value
jan 1, 2006
33.37
+33.37
0.0%
jan 1, 2007
34.6
+1.23
3.68%
jan 1, 2008
35.186
+0.586
1.69%
jan 1, 2009
37.01
+1.824
5.18%
jan 1, 2010
37.271
+0.261
0.71%
jan 1, 2011
39.66
+2.389
6.41%
jan 1, 2012
39.378
-0.282
-0.71%
jan 1, 2013
39.532
+0.154
0.39%
Ranking of countries by current statistics by years