Download This statistics in other country:
Timeline:
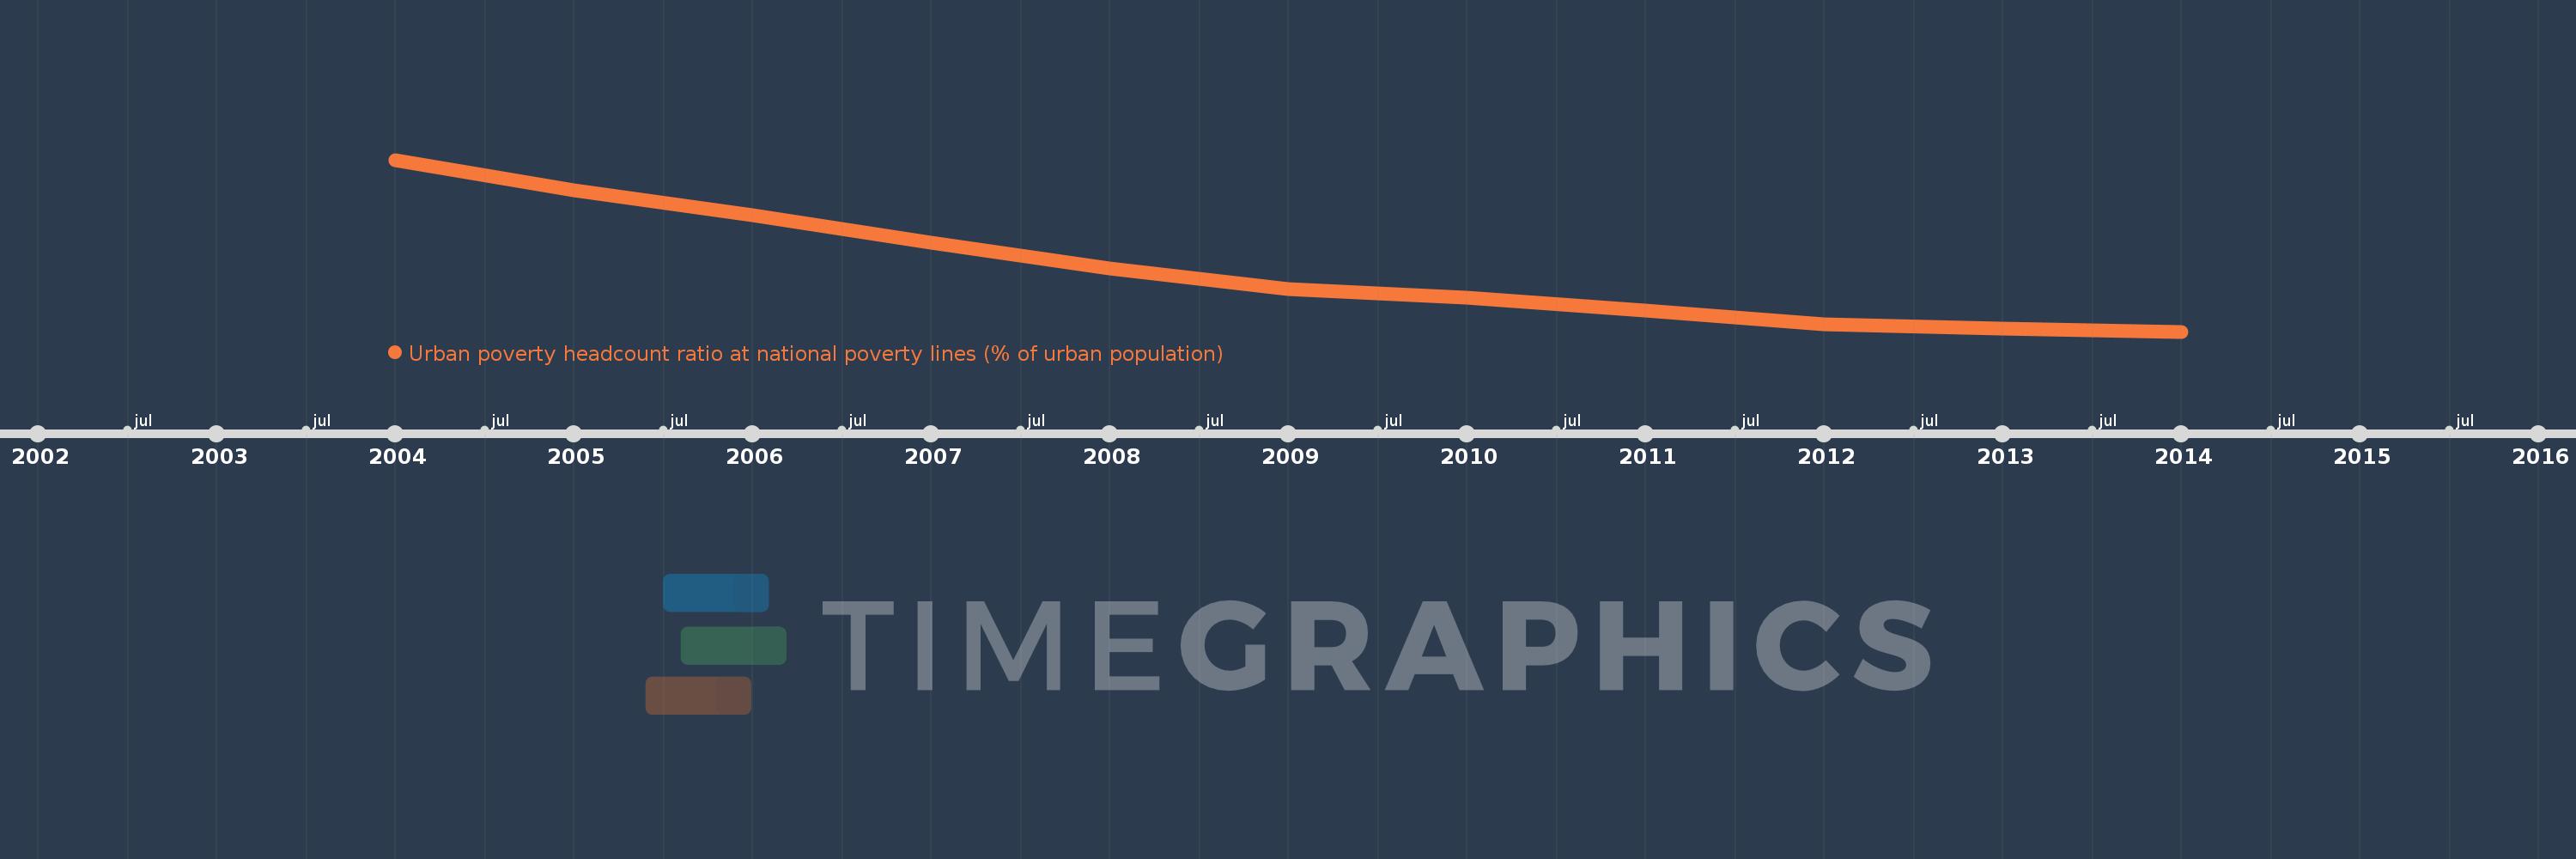
This timeline shows a graph from 2004 to 2014 of Argentina. No data until 2003. Number of actual observations by date: 11.
Source name:
World Development Indicators
Source organization:
World Bank, Global Poverty Working Group. Data are based on World Bank's country poverty assessments and country Poverty Reduction Strategies.
Categories, topics:
Poverty, Urban Development
Last updated:
apr 23, 2017
Indicators value changes by year
At the date of observation
Value
Absolute change
Change from the previous value
jan 1, 2004
47.8
+47.8
0.0%
jan 1, 2005
40.2
-7.6
-15.9%
jan 1, 2006
33.8
-6.4
-15.92%
jan 1, 2007
26.9
-6.9
-20.41%
jan 1, 2008
20.6
-6.3
-23.42%
jan 1, 2009
15.3
-5.3
-25.73%
jan 1, 2010
13.2
-2.1
-13.73%
jan 1, 2011
9.9
-3.3
-25.0%
jan 1, 2012
6.5
-3.4
-34.34%
jan 1, 2013
5.4
-1.1
-16.92%
jan 1, 2014
4.7
-0.7
-12.96%
Ranking of countries by current statistics by years