33
/
AIzaSyB4mHJ5NPEv-XzF7P6NDYXjlkCWaeKw5bc
November 30, 2025
167006
Kazakhstan
KAZ
true
2
1
Urban poverty headcount ratio at national poverty lines (% of urban population)
2016,2015,2014,2013,2012,2011,2010,2009,2008,2007,2006,2005,2004,2003,2002
Create a timeline
Public Timelines
For education
For educational institutions
For teachers
For students
Cabinet
For educational institutions
For teachers
For students
Open cabinet
FAQ
Close
Create a timeline
Public timelines
FAQ
About & Feedback
Terms
Privacy
FAQ
Support 24/7
Cabinet
Get premium
Donate
Download
Global statistics library
→
Kazakhstan
→
Urban poverty headcount ratio at national poverty lines (% of urban population)
This statistics in other country:
Afghanistan
Albania
Algeria
Angola
Argentina
Armenia
Azerbaijan
Bangladesh
Belarus
Benin
Bhutan
Bolivia
Botswana
Burkina Faso
Burundi
Cabo Verde
Cambodia
Cameroon
Central African Republic
Chad
Chile
Colombia
Comoros
Congo, Dem. Rep.
Congo, Rep.
Costa Rica
Cote d'Ivoire
Dominican Republic
Ecuador
Egypt, Arab Rep.
El Salvador
Equatorial Guinea
Eritrea
Ethiopia
Fiji
Gabon
Gambia, The
Georgia
Ghana
Guatemala
Guinea
Guinea-Bissau
Haiti
Honduras
India
Indonesia
Iraq
Jamaica
Jordan
Kazakhstan
Kenya
Kosovo
Kyrgyz Republic
Lao PDR
Lesotho
Liberia
Madagascar
Malawi
Malaysia
Maldives
Mali
Mauritania
Mexico
Moldova
Mongolia
Montenegro
Morocco
Mozambique
Namibia
Nepal
Nicaragua
Niger
Nigeria
Pakistan
Papua New Guinea
Paraguay
Peru
Philippines
Rwanda
Sao Tome and Principe
Senegal
Seychelles
Sierra Leone
South Africa
South Sudan
Sri Lanka
Sudan
Swaziland
Syrian Arab Republic
Tajikistan
Tanzania
Thailand
Timor-Leste
Togo
Turkey
Tuvalu
Uganda
Uruguay
Vietnam
West Bank and Gaza
Yemen, Rep.
Zambia
Zimbabwe
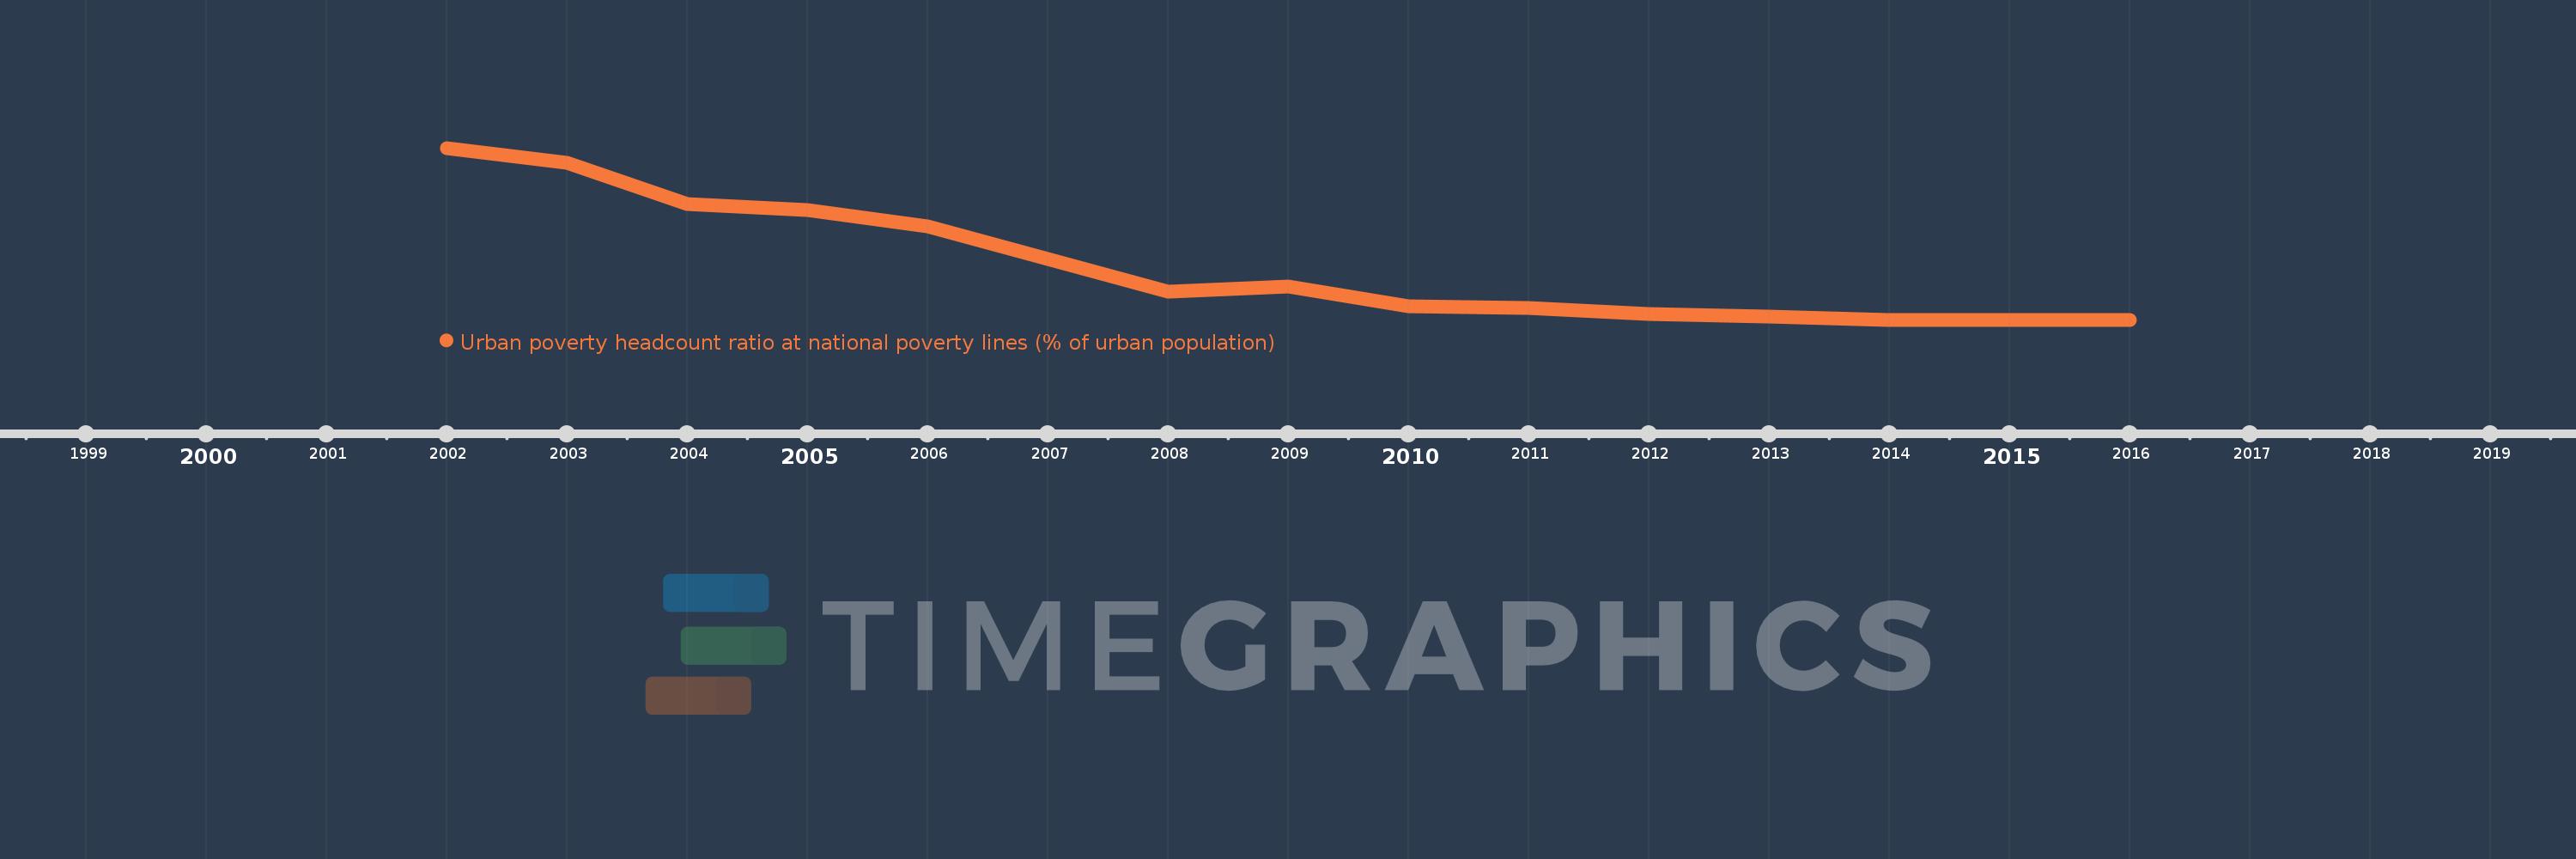
Timeline:
This timeline shows a graph from
2002
to
2016
of Kazakhstan. No data until
2001
. Number of actual observations by date:
15
.
Source name:
World Development Indicators
Source organization:
World Bank, Global Poverty Working Group. Data are based on World Bank's country poverty assessments and country Poverty Reduction Strategies.
Categories, topics:
Poverty, Urban Development
Last updated:
apr 23, 2017
Indicators value changes by year
Meaning:
12.127
Minimum:
1.3
jan 1, 2014
Maximum:
36.0
jan 1, 2002
At the date of observation
Value
Absolute change
Change from the previous value
jan 1, 2002
36.0
+36.0
0.0%
jan 1, 2003
33.0
-3.0
-8.33%
jan 1, 2004
24.7
-8.3
-25.15%
jan 1, 2005
23.4
-1.3
-5.26%
jan 1, 2006
20.2
-3.2
-13.68%
jan 1, 2007
13.6
-6.6
-32.67%
jan 1, 2008
6.9
-6.7
-49.26%
jan 1, 2009
8.1
+1.2
17.39%
jan 1, 2010
4.1
-4.0
-49.38%
jan 1, 2011
3.7
-0.4
-9.76%
jan 1, 2012
2.4
-1.3
-35.14%
jan 1, 2013
1.9
-0.5
-20.83%
jan 1, 2014
1.3
-0.6
-31.58%
jan 1, 2015
1.3
0.0
0.0%
jan 1, 2016
1.3
0.0
0.0%
Ranking of countries by current statistics by years
About & Feedback
Terms
Privacy
FAQ
Support 24/7
Cabinet
Get premium
Donate
The service accepts bank transfer (ACH, Wire) or cards (Visa, MasterCard, etc). Processed by Stripe.
Secured with SSL