Download This statistics in other country:
Timeline:
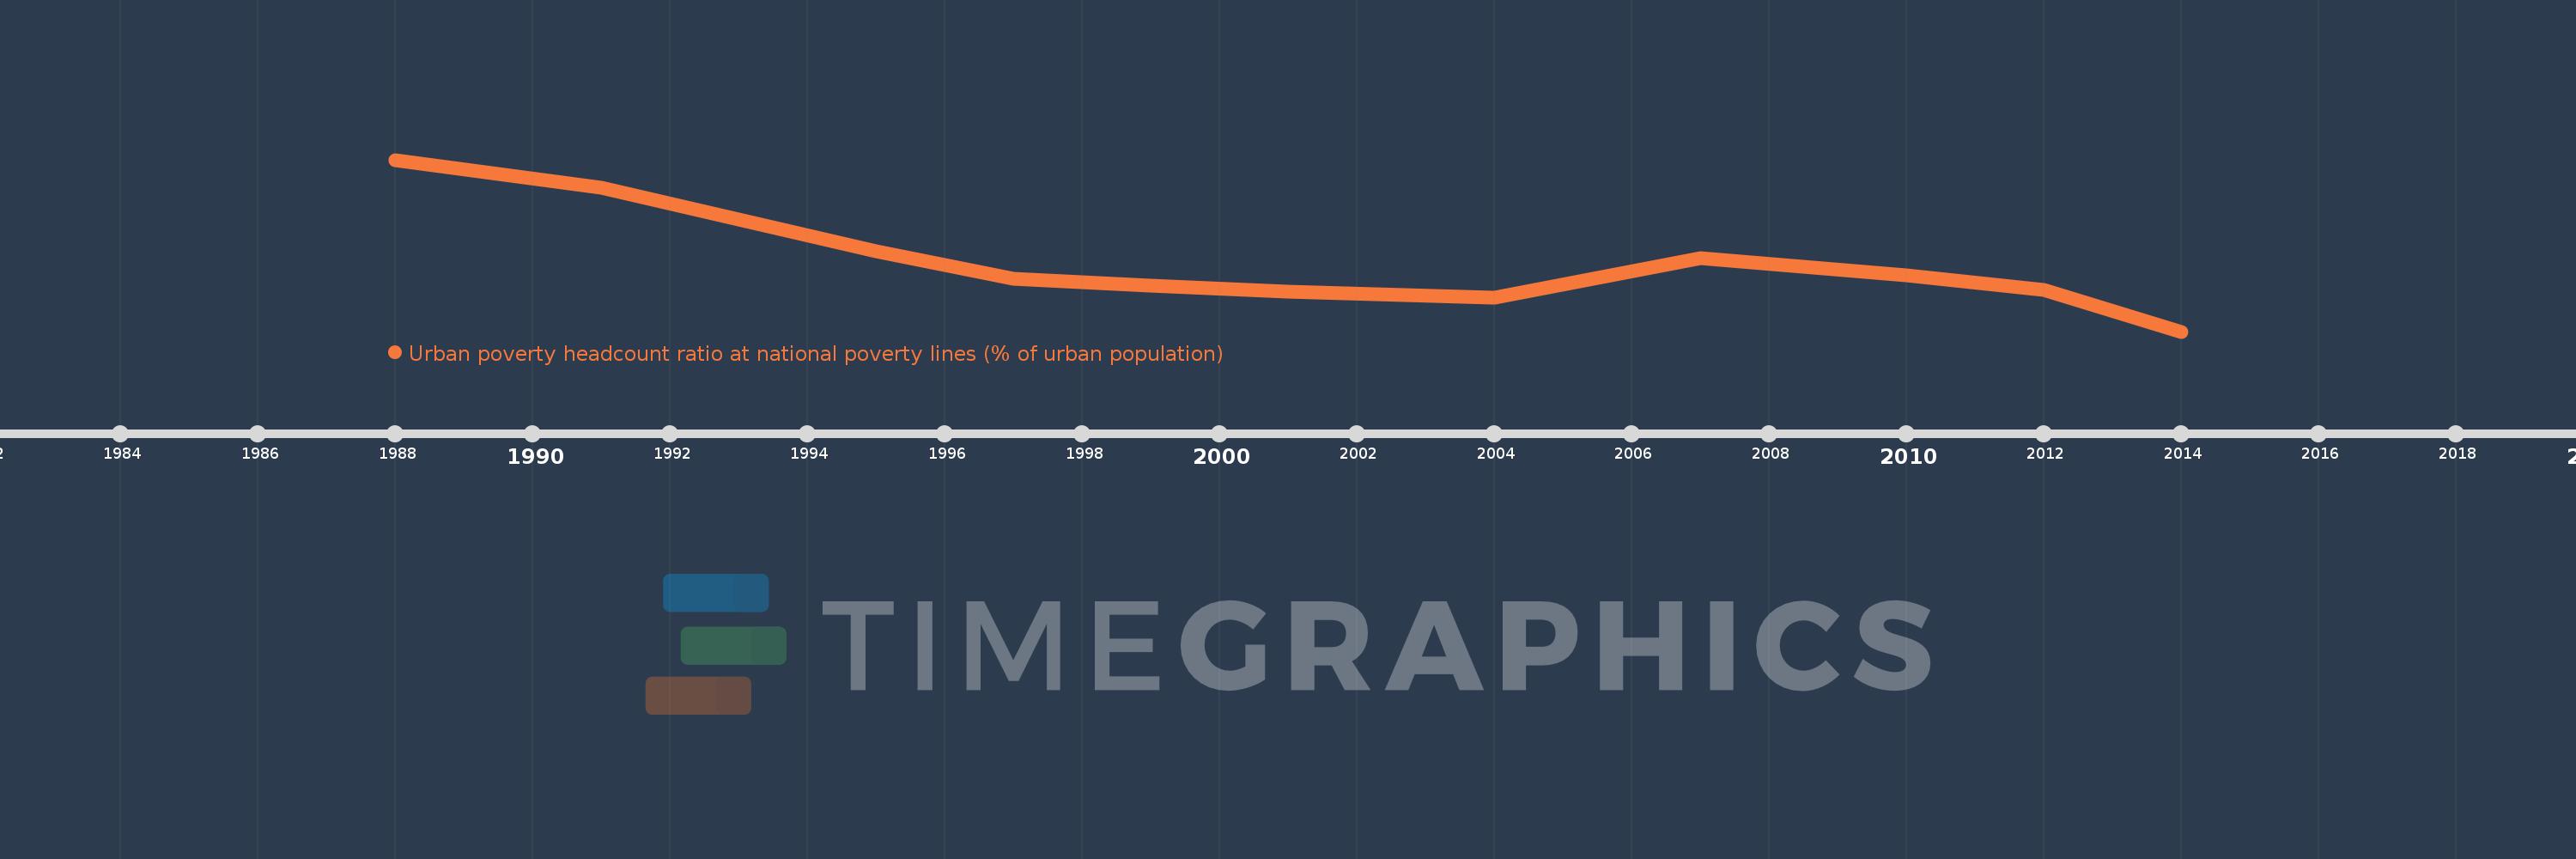
This timeline shows a graph from 1988 to 2014 of Chile. No data until 1987. Number of actual observations by date: 12.
Source name:
World Development Indicators
Source organization:
World Bank, Global Poverty Working Group. Data are based on World Bank's country poverty assessments and country Poverty Reduction Strategies.
Categories, topics:
Poverty, Urban Development
Last updated:
apr 23, 2017
Indicators value changes by year
At the date of observation
Value
Absolute change
Change from the previous value
jan 1, 1988
43.6
+43.6
0.0%
jan 1, 1991
38.5
-5.1
-11.7%
jan 1, 1993
32.7
-5.8
-15.06%
jan 1, 1995
27.0
-5.7
-17.43%
jan 1, 1997
22.0
-5.0
-18.52%
jan 1, 1999
20.7
-1.3
-5.91%
jan 1, 2001
19.7
-1.0
-4.83%
jan 1, 2004
18.5
-1.2
-6.09%
jan 1, 2007
25.8
+7.3
39.46%
jan 1, 2010
22.6
-3.2
-12.4%
jan 1, 2012
19.9
-2.7
-11.95%
jan 1, 2014
12.4
-7.5
-37.69%
Ranking of countries by current statistics by years