33
/
AIzaSyB4mHJ5NPEv-XzF7P6NDYXjlkCWaeKw5bc
November 30, 2025
70256
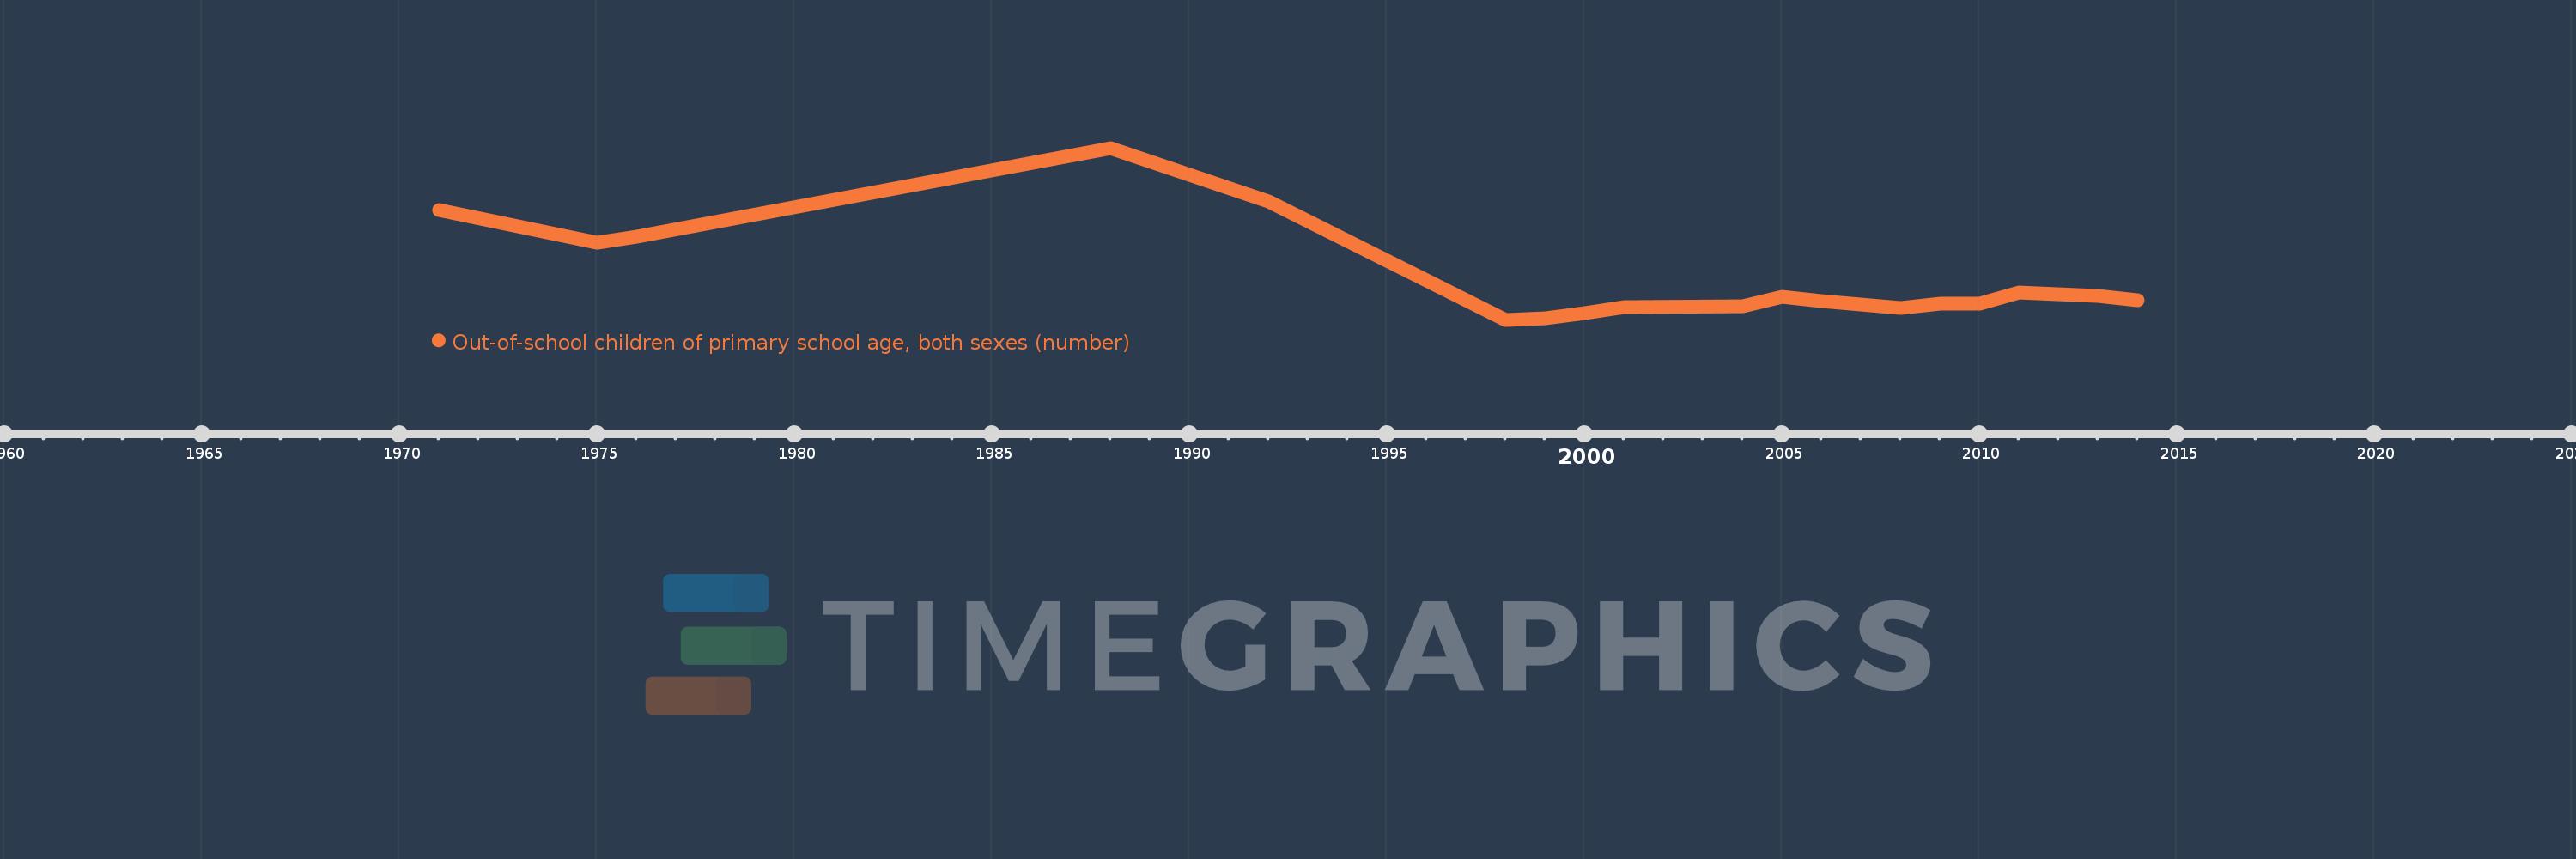
Argentina
ARG
true
2
1
Out-of-school children of primary school age, both sexes (number)
2014,2013,2012,2011,2010,2009,2008,2007,2006,2005,2004,2001,2000,1999,1998,1992,1988,1976,1975,1971