33
/
AIzaSyB4mHJ5NPEv-XzF7P6NDYXjlkCWaeKw5bc
November 1, 2025
112707
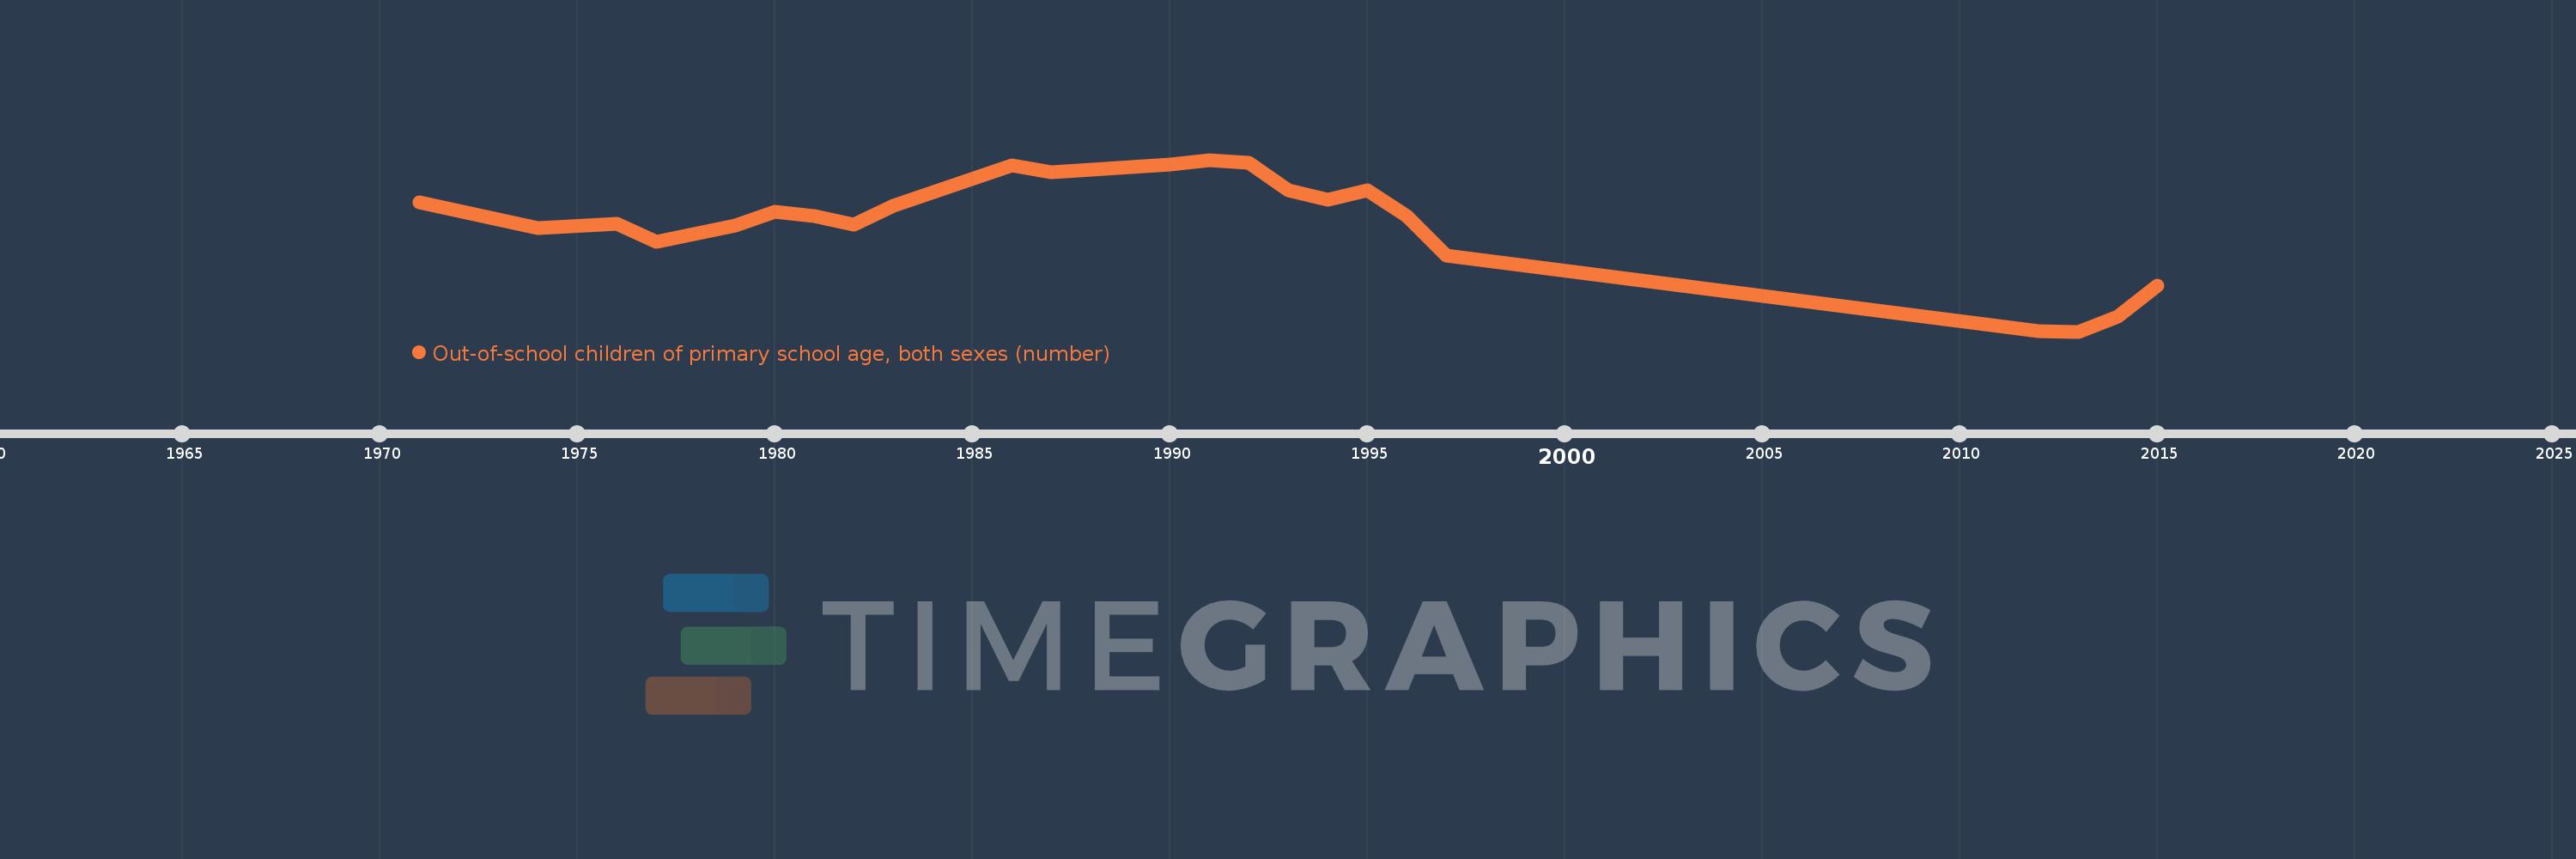
Costa Rica
CRI
true
2
1
Out-of-school children of primary school age, both sexes (number)
2015,2014,2013,2012,1997,1996,1995,1994,1993,1992,1991,1990,1988,1987,1986,1983,1982,1981,1980,1979,1977,1976,1974,1973,1971