33
/
AIzaSyB4mHJ5NPEv-XzF7P6NDYXjlkCWaeKw5bc
November 1, 2025
265037
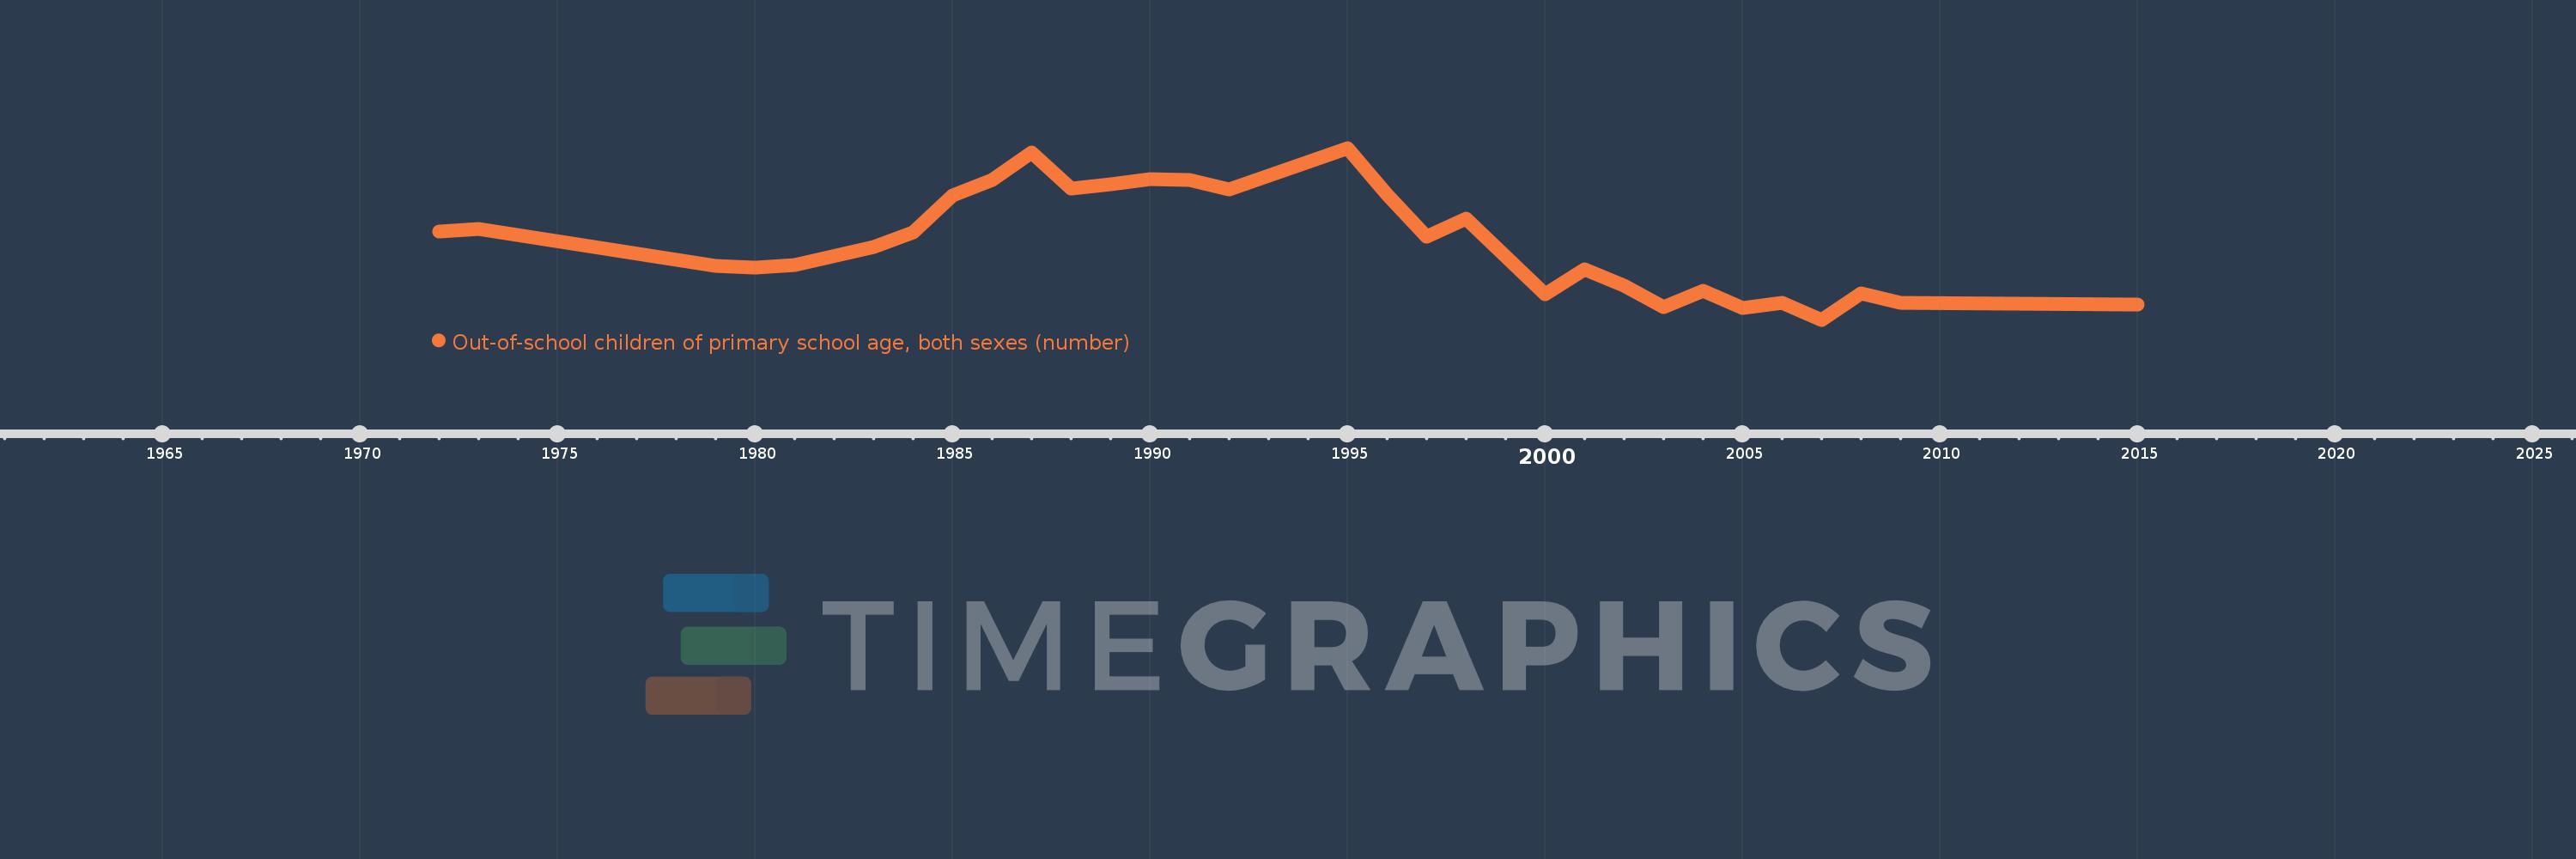
Togo
TGO
true
2
1
Out-of-school children of primary school age, both sexes (number)
2015,2009,2008,2007,2006,2005,2004,2003,2002,2001,2000,1998,1997,1996,1995,1992,1991,1990,1989,1988,1987,1986,1985,1984,1983,1981,1980,1979,1973,1972